This the first in a sequence of three posts. The second describes alternatives to the unemployment rate for C&I loss forecasting, and the third one provides more evidence why the unemployment rate is a poor choice for C&I loss forecasting.
Recently, we were surprised to learn that many banks use a forecasted unemployment rate as a predictive or explanatory variable for CECL modeling for both consumer and commercial (C&I) loans. Presumably, this means they use it for C&I stress testing, too. While it might make sense for consumer loans, it makes a lot less sense for commercial loans.
Before proceeding, it’s worth noting that from reading the Fed’s summaries of its CCAR scenarios they seem to believe that unemployment is a main “driver” of all of types of loan losses. Let’s see if that’s the case and if it’s possible to lead from behind.
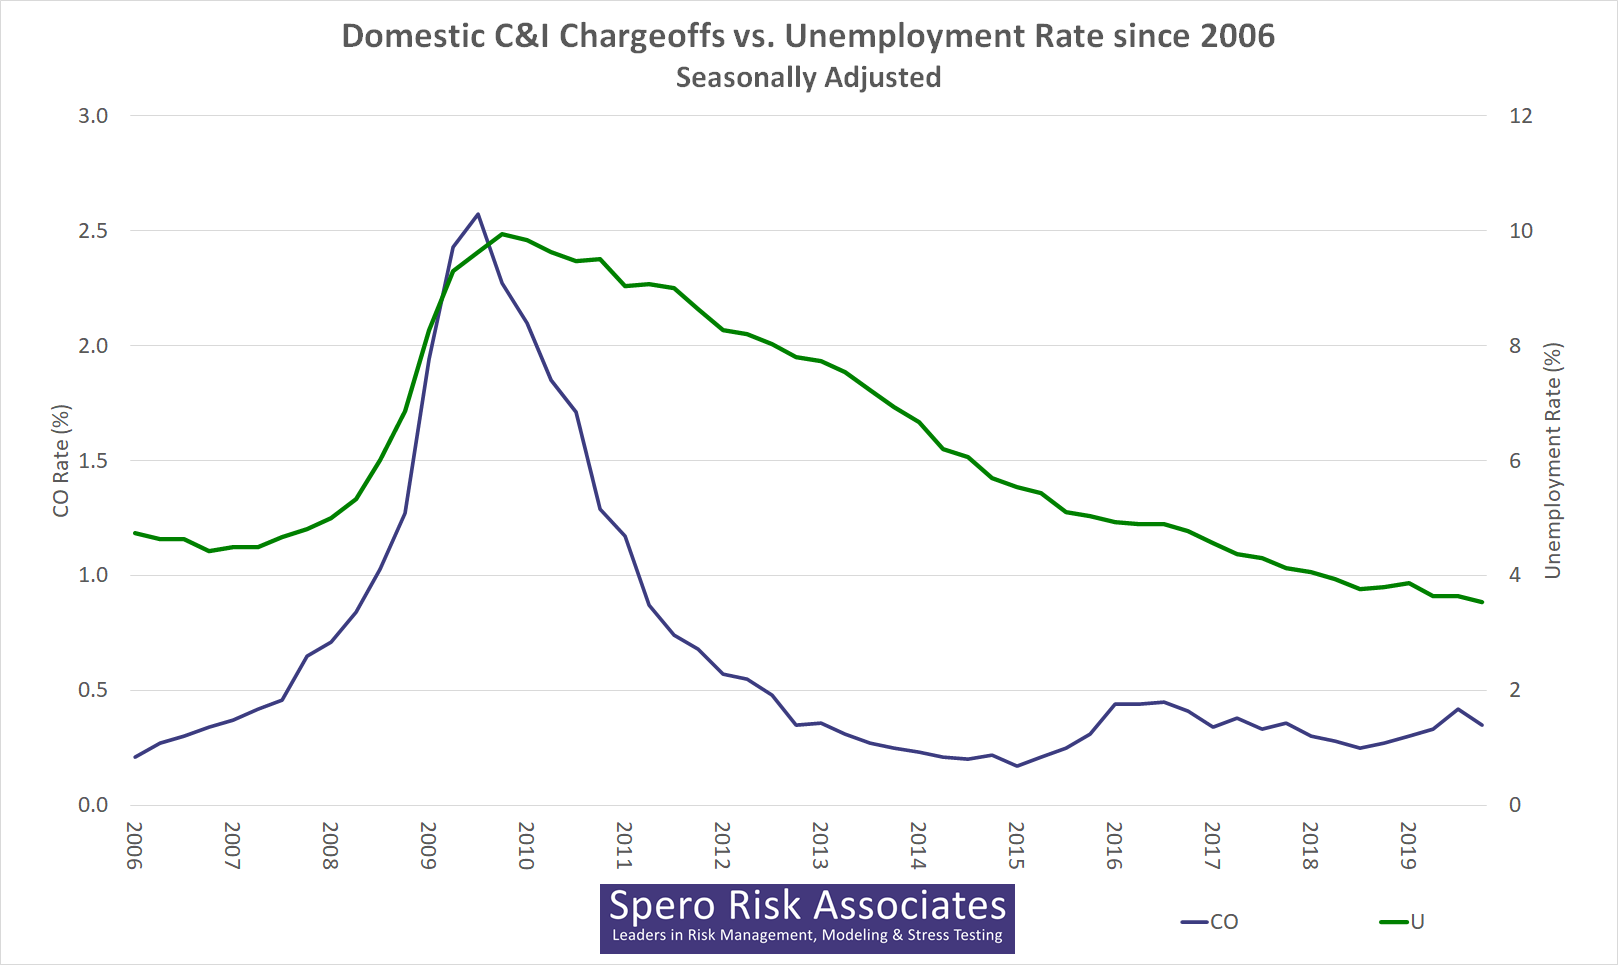
We think that firms—or in some cases, their outside consultants and developers or vendors—were misled by near simultaneity of the peaks in the seasonally-adjusted charge-offs (Q3 2009) and the seasonally-adjusted unemployment rate (Q4 2009) during The Financial Crisis.1,[BTW, we think that NSA sequences should always be investigated, especially for stress testing, and we’ll include those sequences in latter posts.] We also think that the Fed ignored its own FRED data and was misled by this, too.
However, a look at a longer sequence of the same data shows that in the previous two recessions, unemployment peaked three quarters—that’s a full nine months—after charge-offs peaked. So, while they’re clearly correlated, which we show here, it seems that charge-offs–at least their peaks—lead unemployment, rather than lag it. But there’s more.
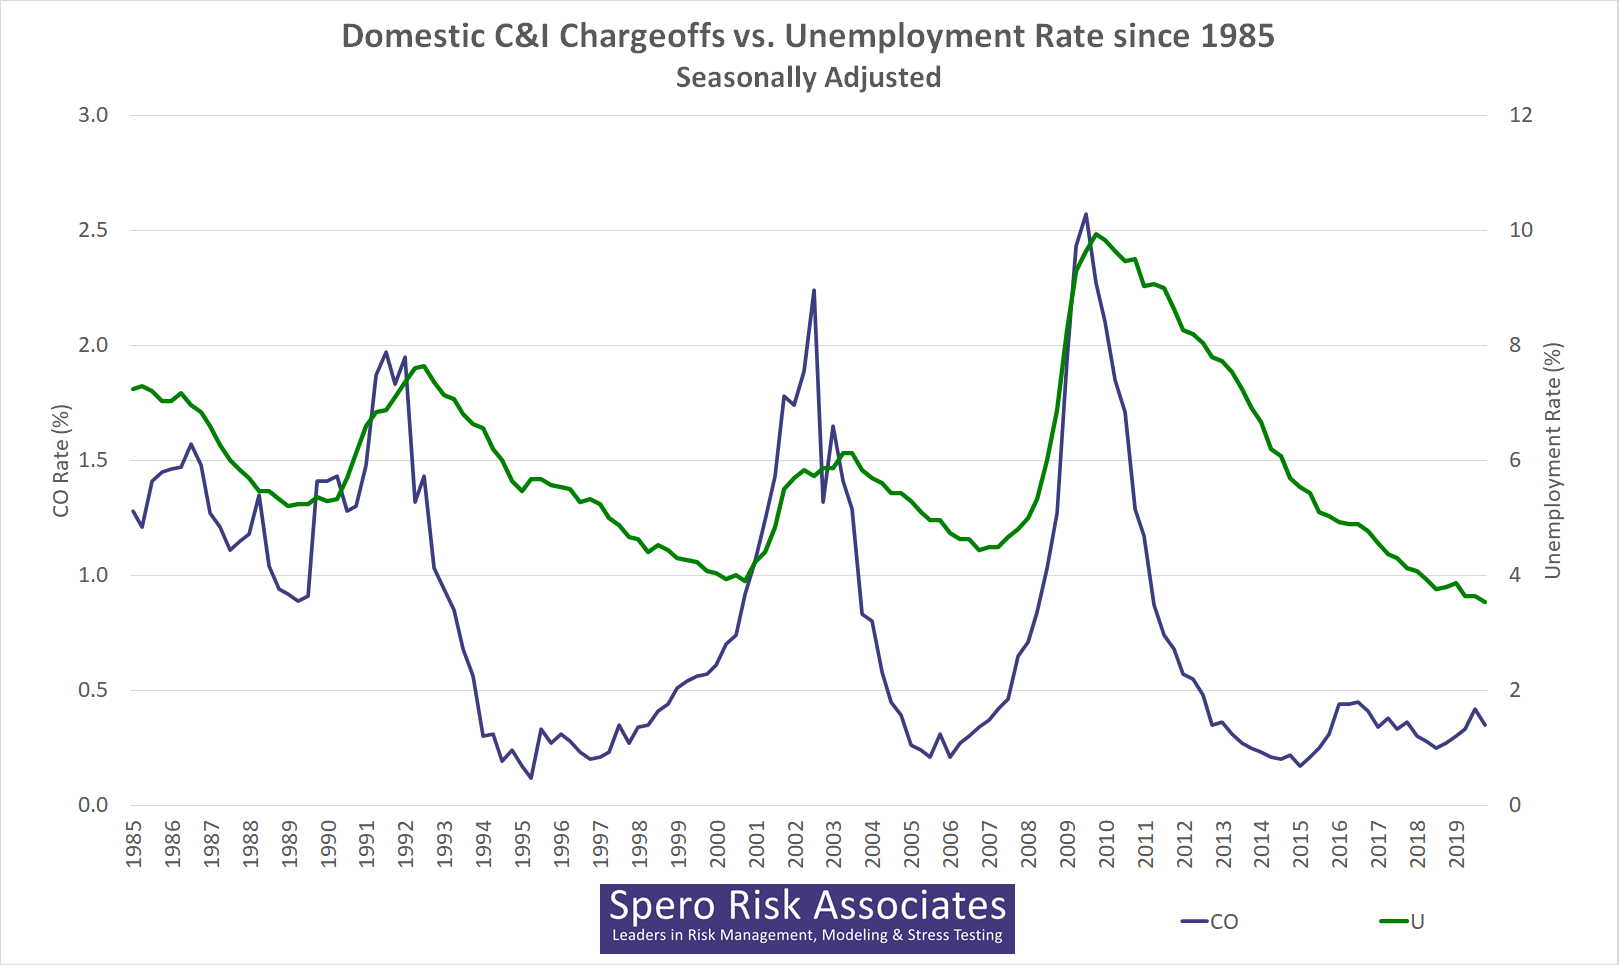
Why mention it? Because quarterly charge-offs consist of (1) roughly 50% of losses given defaults from that quarter plus the other 50% of losses from defaults in the previous seven quarters. So, while we can’t give a precise estimate, that means that defaults peaked even earlier that charge-offs—let’s say, on average, by one quarter. That means that defaults and unemployment rate weren’t close to peaking simultaneously during The Financial Crisis, and it means that corporate loan defaults peaked an entire year earlier than unemployment in the previous two recessions.
So, if your job is to estimate expected credit losses, then–all else equal–you’re likely to be low and slow to forecast C&I losses, especially in scenarios of the greatest interest. (The current pandemic being an exception for many reasons.)
By the way, you can generate similar graphs with data from FRED:
- CO: https://fred.stlouisfed.org/series/CORBLACBS
- U: https://fred.stlouisfed.org/series/UNRATE