When Higher Defaults Don’t Mean Higher Hurricane Mortgage Losses
Our study investigated the effect of six major weather events on Fannie mortgage portfolio losses. We initially focused on five significant hurricanes: Ian (Florida, 2022), Harvey (Texas, 2017), Irma (Florida, 2017), Sandy (Long Island, NY, 2012), and Katrina (Louisiana and Mississippi, 2005). During our analysis, we discovered an unusual spike in 2016/17 Louisiana defaults that was traced back to a major flooding event, expanding our scope to six events in seven locations.
We analyzed Fannie Mae’s publicly available mortgage loan data; so, our findings should not be directly applied to bank-held mortgages or other loan types without making proper adjustments.
Why do recent hurricanes barely effect mortgage losses, i.e., how can defaults spike 4-7× but losses don’t?
The beneficial offset: For all post-crisis events examined, net charge-offs have remained at or below baseline levels, a dramatic shift from the 6× elevated rates observed after Hurricane Katrina in both Mississippi and Louisiana. While default rates continue to spike during hurricanes (150% to 600% of normal levels), Loss Given Default rates decline by approximately the same proportion. Multiplying these elevated defaults by suppressed LGDs produces minimal net charge-off impact. This offsetting effect likely reflects post-financial crisis improvements in insurance requirements, risk management practices, and underwriting standards that have substantially reduced loss severity.
For example, Hurricane Katrina (2005) produced net charge-off rates 6x higher than hurricane-free/crisis-free periods. The same geographic region experienced the 2016 Louisiana flooding; however, those later losses were effectively zero. Same location, same disaster type, radically different outcome. This comparison shows the post-crisis regulatory framework seems to have created loss mitigants that didn’t exist in 2005. Lower LGDs during hurricanes likely reflect insurance proceeds, FEMA assistance, forbearance programs, and in some cases strategic defaults where borrowers delay payments until assistance arrives.
Why does this matter for CECL and loss forecasting models, methods, and forecasts?
The challenge: Weather-related default spikes and LGD drops can distort the historical relationship between economic indicators and credit losses in your models. After hurricanes, decreased LGDs tend to cancel out increase default rates but that relationship is different in both good times and in times of stress, i.e., when both increase.
You must explicitly control for hurricane periods to maintain model accuracy—accounting for BOTH the PD spike AND the LGD drop, i.e., control for (1) higher, weather-related defaults so as to not over-estimate probabilities of default and (2) controling for lower LGDS during extreme events so as to not under-estimate prospective losses.
Click any card to view detailed risk-adjusted analysis including default patterns and loss given default metrics
Key Findings Across Events
Event-specific insights that inform modern hurricane risk management
Hurricane Ian, Florida, 2022
September 28, 2022
Ian’s Path
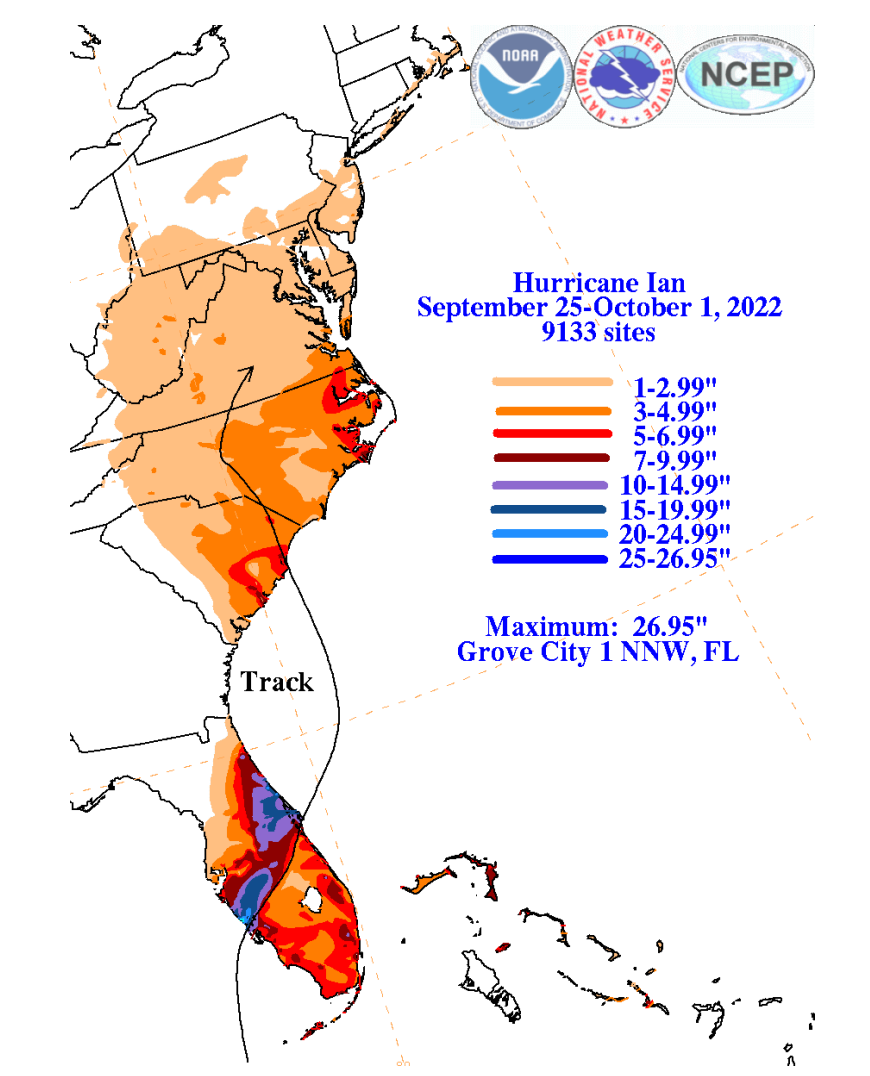
Hurricane Ian made landfall in Florida on September 28, 2022, as a powerful Category 4 hurricane with maximum sustained winds of 115 mph. The storm’s most devastating characteristic was its extreme rainfall, with some locations experiencing virtually unprecedented precipitation. Placida, for example, received 15 inches of rain in just 12 hours—an event comparable to a 1-in-1,000-year rainfall occurrence.¹ Combined with catastrophic flooding, Ian produced storm surge of 12 to 18 feet above ground level in affected areas.
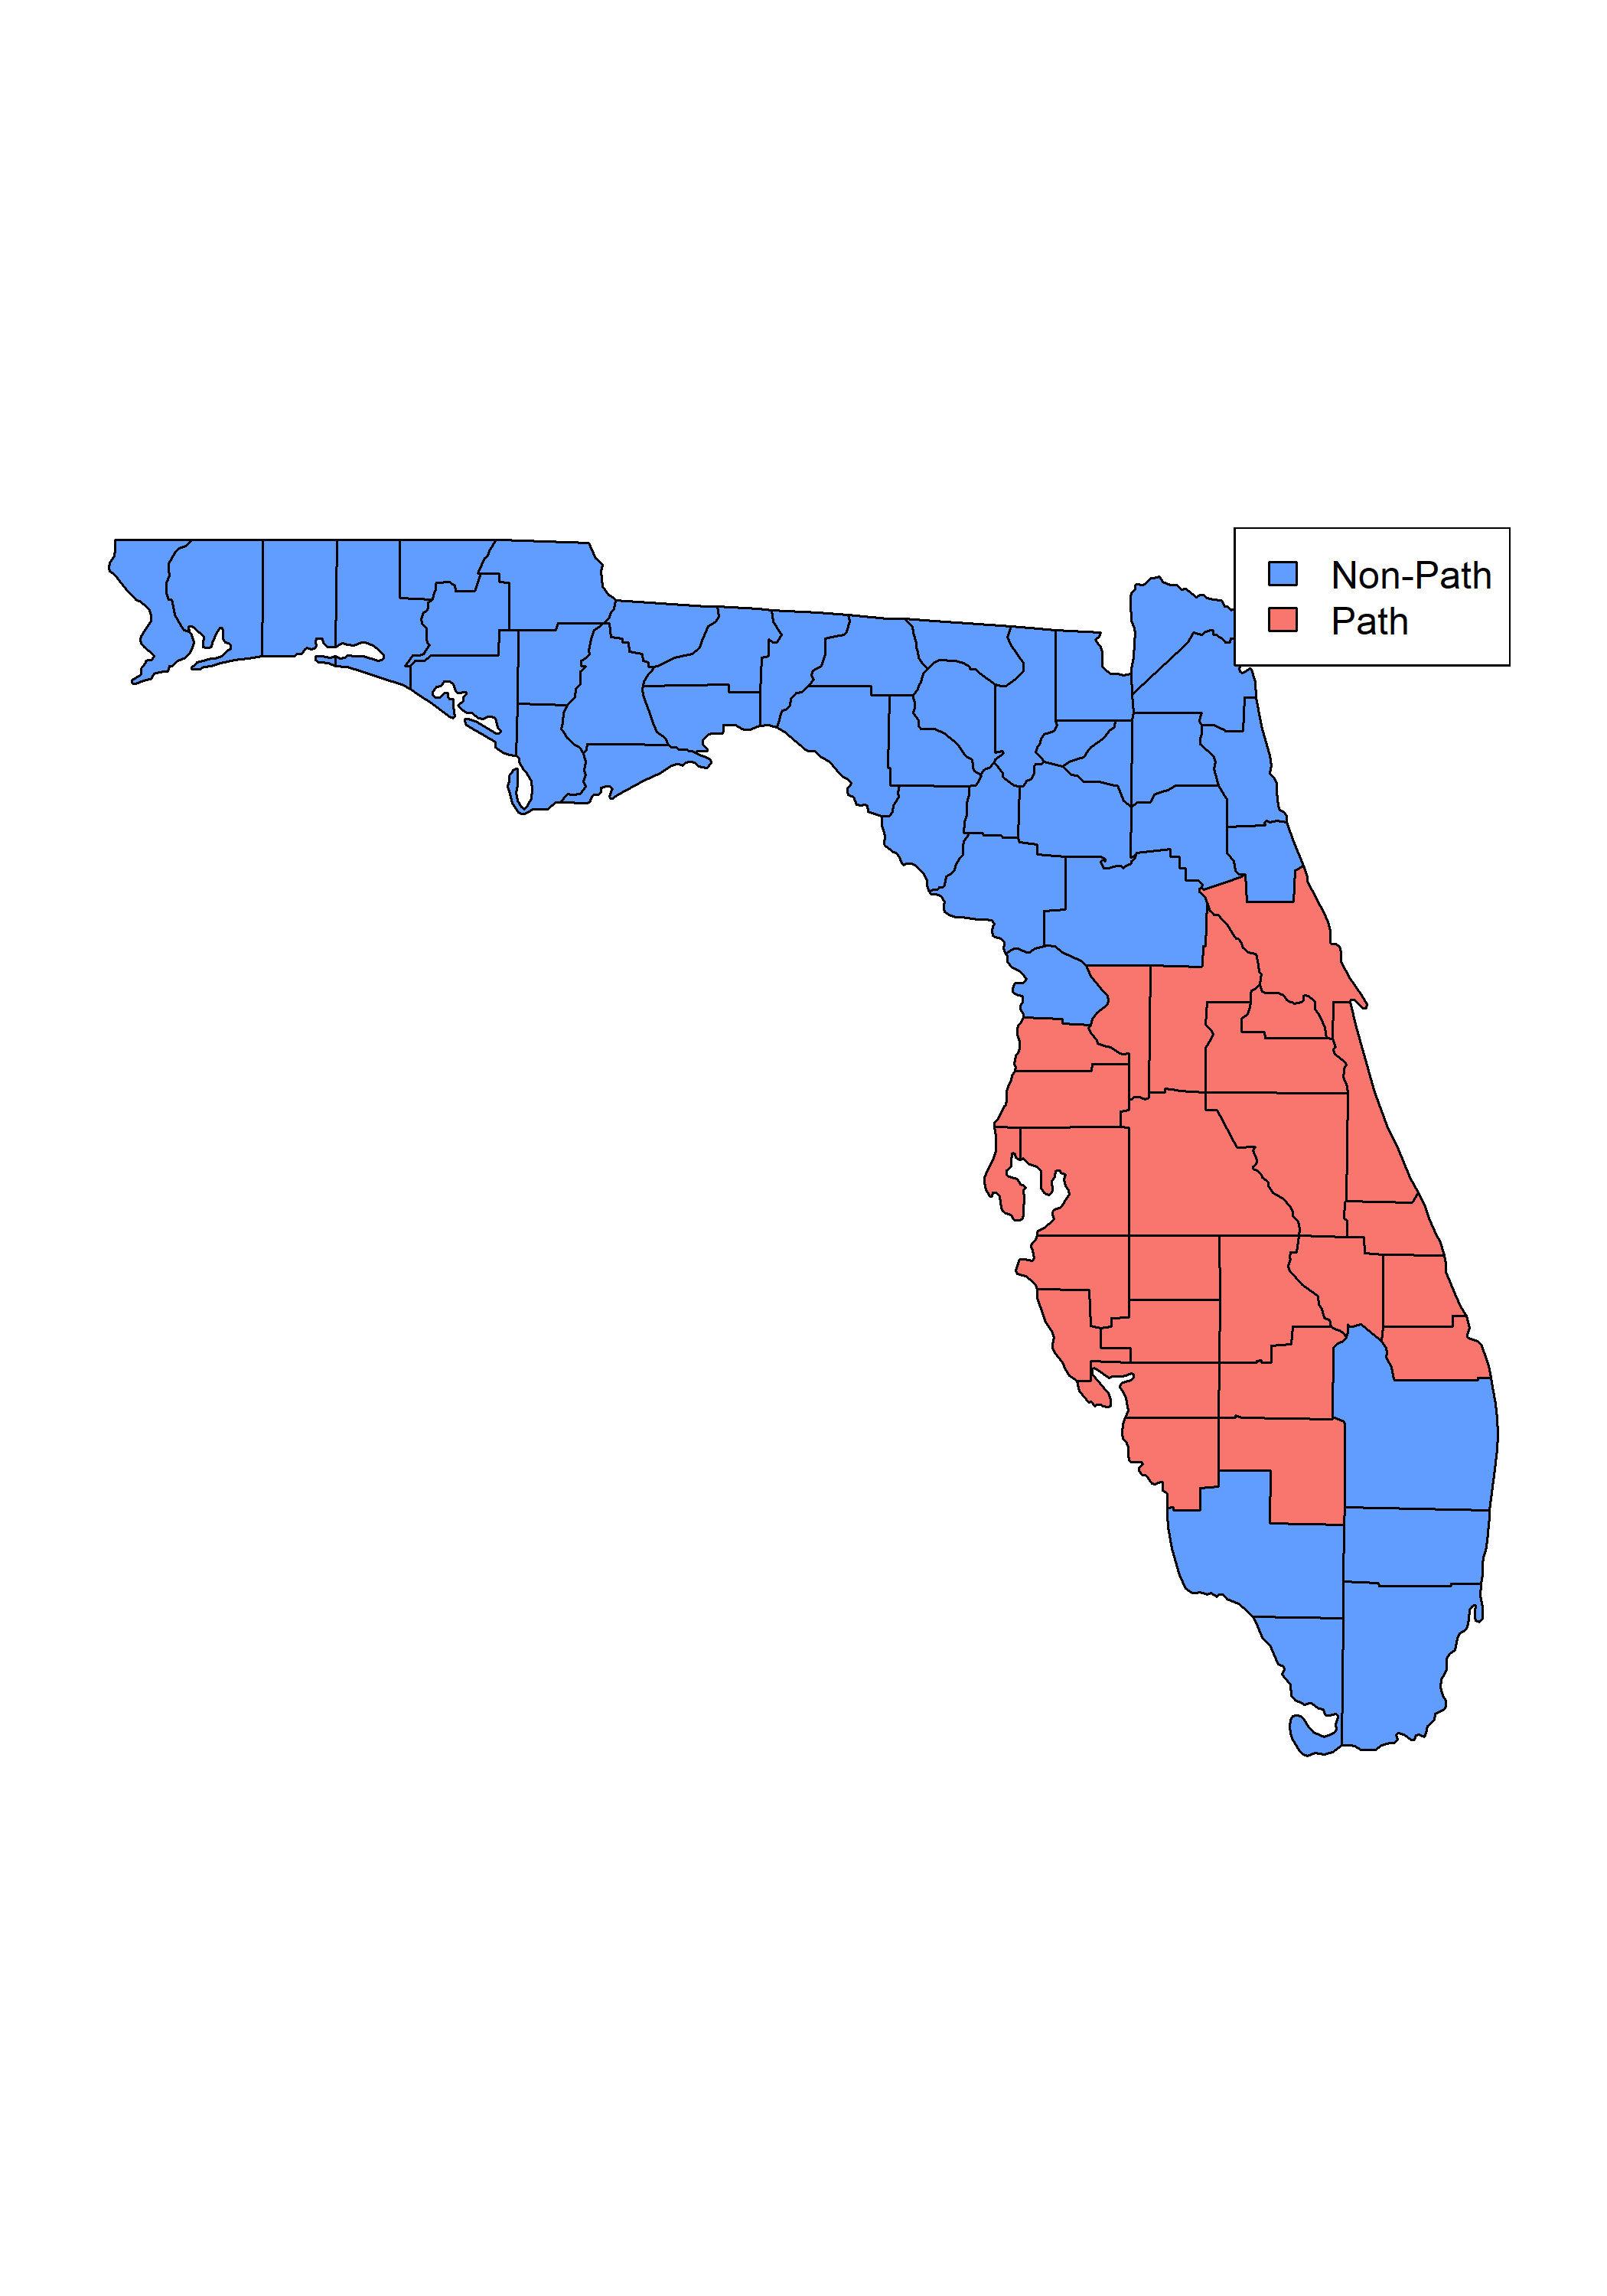
The economic effect was also historic: Ian became the costliest hurricane in Florida’s history and the third-costliest hurricane in U.S. history overall. To analyze the effect on mortgages across the state, we classified Florida counties based on the USGS post-Ian flooding report, identifying those directly affected by the storm’s path (shown in red on our maps) versus those outside the zone (shown in blue).
Ian Path Counties
Florida counties classified as in-path (red) vs. outside path (blue) based on USGS flooding data
USGS Ian Flooding Report
Detailed flooding analysis (click image to view full PDF report)
Default Rates in Florida through Time
We selected three high-default quarters following Ian, split between path (red) and non-path (blue). These are compared to statewide benchmarks: hurricane-free/crisis-free periods (green) and financial crisis (orange). While Hurricane Irma (pink) and COVID (purple) appear in the time series, both are excluded from the our risk-adjusted analysis in following sections.
Comparing to other Florida events adds perspective: despite being the costliest hurricane in Florida’s history, Irma’s default rates (pink) were 4x higher than Ian’s (blue). Ian’s path rates were modest at 1.3x hurricane-free/crisis-free averages and roughly one-fourth of crisis-period rates
Ian exhibits the expected pattern: the red spike corresponds to higher path default rates with blue non-path rates tracking green hurricane-free/crisis-free levels. However, this comparison is incomplete because it does not control for risk.
Default Rates Through Time
Default rates for in-path (red), non-path (blue), hurricane/crisis-free (green), crisis (orange), Irma (pink), COVID (purple)
Comparison of Risk-adjusted Default Rates
While risk can be measured across multiple dimensions such as FICO, LTV, and DTI, updated values aren’t readily available for Fannie loans. We developed and used the “Spero Portfolio Risk Measure” —a proprietary metric that is robust, intuitive, and theoretically sound. Constructed on a loan-by-loan basis and updated each quarter, we then aggregated similar observations to make our comparisons on a risk-adjusted basis. Our measure provides comprehensive portfolio or sub-portfolio assessments. Our methodology is transparent and explainable—never a black box solution.
We’ve applied similar analytical frameworks to develop effective and intuitive loss forecasting (CECL and stress testing) models using both internal bank data and external data sources, delivering modeling solutions that are both powerful and interpretable.
When we control for risk using the Spero Portfolio Risk Measure, the differences in default rates become more pronounced.
Risk-Adjusted Default Rates
Default Rates as a function of Spero Portfolio Risk Measure
Comparison of Risk-adjusted LGDs
LGDs show almost the reverse pattern, but the differences aren’t as great as with default rates.
LGDs during Ian are similar whether they occur inside or outside the path, but both are uniformly lower than hurricane-free LGDs. Thus, while Ian-related default rates appear to be higher than the other groups, LGDs during normal times appear to be approximately twice the Ian-related LGDs.
We would argue that the difference in hurricane-related LGDs could be attributed to borrowers receiving insurance claims or FEMA assistance, or these could represent strategic defaults or payment delays, since such delays were permitted during the recovery period.
Risk-Adjusted Loss Given Default
LGD as a function of Spero Portfolio Risk Measure
Comparison of Risk-adjusted Charge-off Rates
So, when higher default rates and very low (almost no) LGDs are multiplied together, what happens to charge-off rates? The resulting net charge-off rate becomes statistically indistinguishable from zero. In fact, Ians NCO’s are 8x smaller than the hurricane-free/crisis free average NCO (we do recognize both are very small, avg. nco rate for the path and hurricane-free/crisis-free being 0.08 bps and 0.75 bps respectively.)
The analysis reveals a pattern we’ve found characteristic of post-crisis storms: a sharp, but temporary, spike in delinquencies for loans directly in the storm’s path, with little effect on LGD’s. We suspect this is due to a mature regulatory and support framework, including federally-backed forbearance programs that carry customers through until the National Flood Insurance Program and FEMA assistance is available.
Risk-Adjusted Net Charge-offs
NCO (PD x LGD) as a function of Spero Portfolio Risk Measure
Footnotes
1. NOAA National Weather Service; U.S. Geological Survey Hurricane Ian Documentation ↑
Hurricane Harvey, Texas, 2017
August 25 – 29, 2017
Harvey’s Path
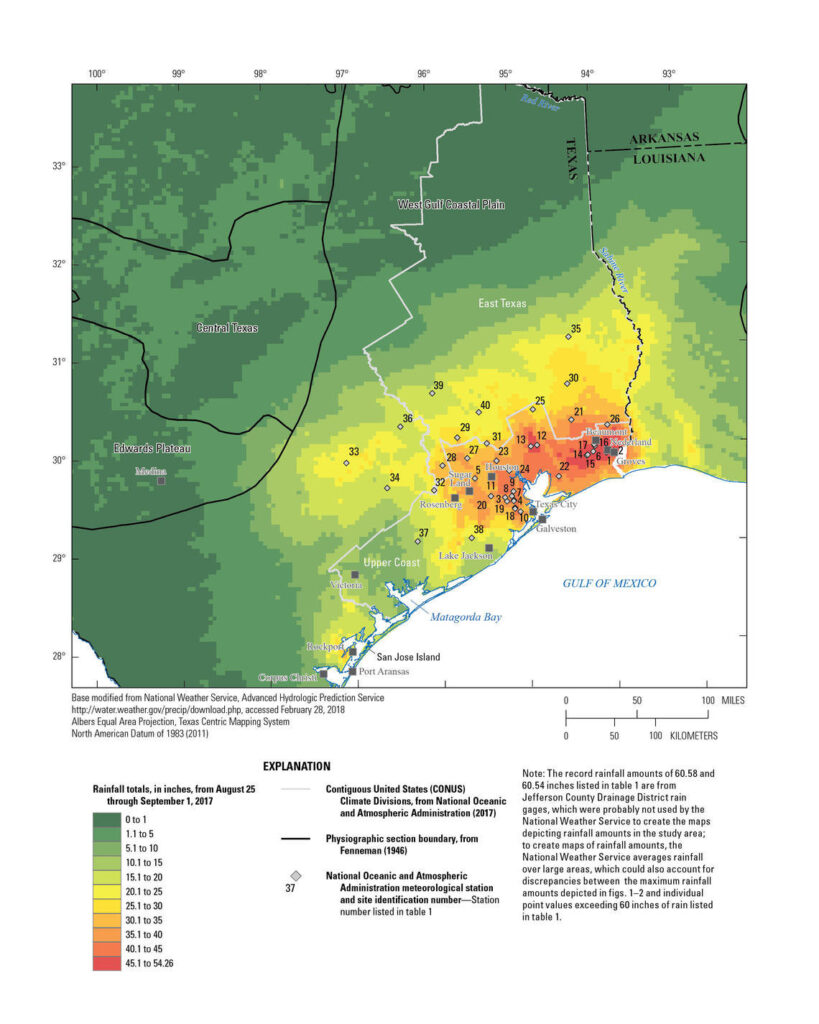
On August 25, 2017, Hurricane Harvey struck a Houston economy that was rebounding from a mid-decade downturn in oil prices. The storm’s defining feature was not wind, but unprecedented rainfall. Harvey stalled out and lingered for approximately four days, dropping over 50 inches of rain in parts of southeast Texas and causing catastrophic flooding in areas far outside designated floodplains, with over 270,000 homes impacted, nearly 80,000 homes sustaining at least 18 inches of floodwater, and 23,000 with more than 5 feet of flooding.²
The scale of uninsured exposure was staggering: 80% of households impacted by Harvey lacked flood insurance.³ This left most homeowners reliant on FEMA assistance, which proved inadequate for full recovery. FEMA’s maximum assistance was capped at $33,300, with the agency explicitly stating that “home repair assistance, to repair an owner-occupied primary residence, is intended to make the damaged home safe, sanitary and functional. FEMA will not pay to return a survivor’s home to its pre-disaster condition.”⁴ We suspect this combination of high uninsured exposure and limited federal assistance explains why losses were slightly elevated in Harvey’s path compared to other post-crisis storms.
Despite these immediate challenges, the economic impact proved short-lived. While the storm initially caused job losses, the rebuilding process catalyzed significant employment growth in construction and retail during the fourth quarter of 2017, with payroll employment expanding by 1.9%.⁵
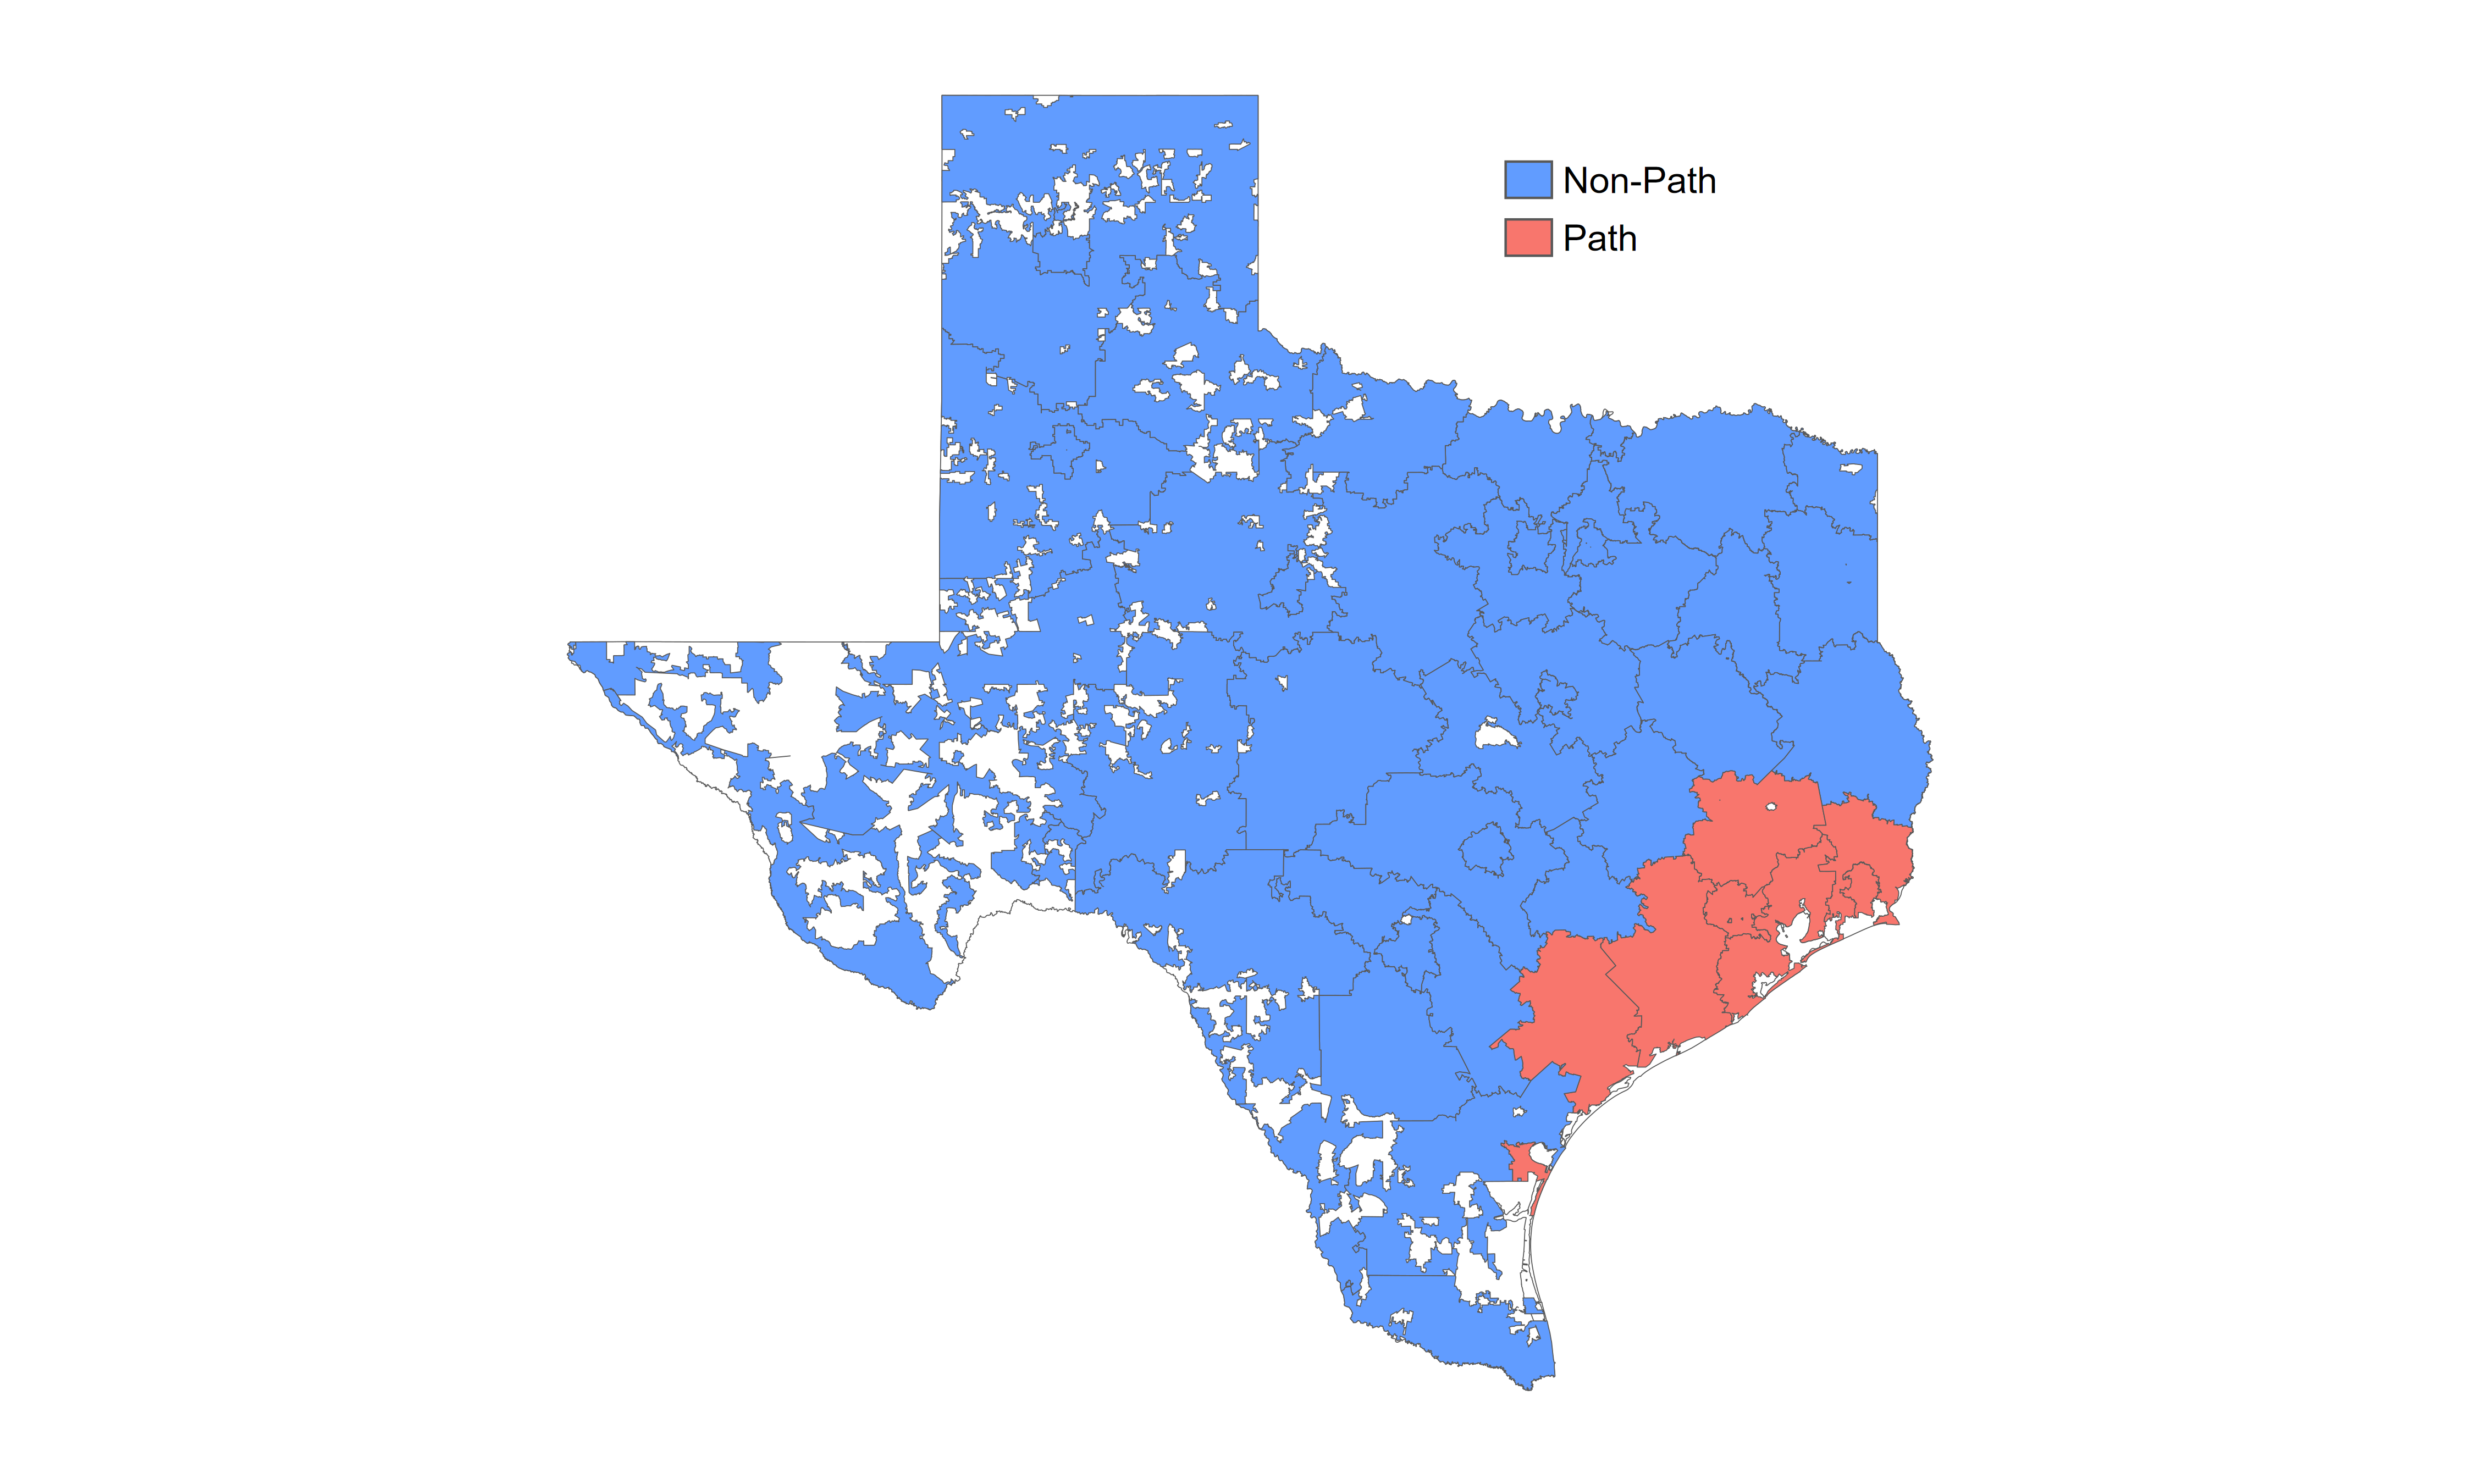
Tropical cyclone damage is generally driven by flooding; so, we used the USGS post-Harvey flooding report to classify Texas counties as in (red) or outside (blue) of Harvey’s path.
Harvey Path Counties
Texas counties classified as in-path (red) vs. outside path (blue) based on USGS flooding data
USGS Harvey Flooding Report
Detailed flooding analysis (click image to view full PDF report)
Default Rates in Texas through Time
We identified three quarters with abnormally high default rates and compared four categories: hurricane path (red), non-path areas during those quarters (blue), Texas-wide hurricane-free/crisis-free periods (green), and Texas-wide financial crisis period (orange). Red and blue correspond to the previous graph.
Consistent with most storms analyzed, post-hurricane (in path) default rates far exceeded financial crisis levels—in this case, 7x higher. Additionally, non-path default rates closely match hurricane-free/crisis-free periods, confirming the localized nature of the hurricane impact.
While risk can be measured across dimensions such as FICO, LTV, and DTI, updated values aren’t readily available for Fannie loans. We developed and used the “Spero Portfolio Risk Measure.” It is a proprietary metric that is robust, intuitive, and theoretically sound. Constructed on a loan-by-loan basis and updated each quarter, we then aggregated similar observations to make our comparisons on a risk-adjusted basis. Our measure provides comprehensive portfolio or sub-portfolio assessments. Our methodology is transparent and explainable—never a black box solution.
Default Rates Through Time
Default rates for in-path (red), non-path (blue), hurricane/crisis-free (green), crisis (orange)
For clients, our methodology is transparent and explainable—never a black box solution. We’ve applied similar analytical frameworks to develop effective and intuitive loss forecasting (CECL and stress testing) models using both internal bank data and external data sources, delivering modeling solutions that are both powerful and interpretable.
Comparison of Risk-adjusted Default Rates
Notice that quarterly default rates within the storm’s path are substantially higher than those outside the path, while those outside of the path are similar to default rates in hurricane-free times. In fact, average quarterly default rate within Harvey’s path (~97 bps) experienced 7x higher hurricane-free/crisis-free times (roughly 13.6 bps) and 4x over crisis rates.
Comparing this to the storm that followed less than a month after, Irma exhibited the same 7x larger versus hurricane-free/crisis-free times but diverged in its crisis comparison (1.2x), a difference explained by baseline conditions: Florida’s crisis was substantially more severe (5x hurricane-free/crisis-free rates) than the crisis context surrounding Harvey (1.7x hurricane-free/crisis-free rates).
Geez, that makes the storm look very bad, but what about LGDs?
Risk-Adjusted Default Rates
Default Rates as a function of Spero Portfolio Risk Measure
Comparison of Risk-adjusted LGDs
LGDs show almost the inverse pattern, but the differences aren’t as great as with default rates.
LGDs during Harvey are similar whether they occur inside or outside the path, but both are uniformly lower than hurricane-free LGDs. Thus, while Harvey-related default rates appear to be three-to-five times higher than the other groups, LGDs during normal times appear to be approximately twice the Harvey-related LGDs.
We would argue that the difference in hurricane-related LGDs could be attributed to borrowers receiving insurance claims or FEMA assistance, or these could represent strategic defaults or payment delays, since such delays were permitted during the recovery period.
Risk-Adjusted Loss Given Default
LGD as a function of Spero Portfolio Risk Measure
Comparison of Risk-adjusted Charge-off Rates
So, when default rates and LGDs are multiplied together, what happens to charge-off rates? The hurricane path experienced net losses of approximately 0.69 basis points—modestly higher than Irma (0.2 bps) and Ian (0.08 bps), where flooding was contained to traditional flood zones. However, context matters: path charge-offs were actually 0.08 bps lower than hurricane-free/crisis-free periods and dramatically lower than the crisis-period rate of 2.28 bps.
It is worth noting that by our measure of risk, the riskiest observations arose in relatively normal weather conditions—the right side of the graph and do correspond to the highest observed default rates on the vertical axis.
What do we make of this? Depending on your portfolio and loan concentrations, that small difference could justify a tiny CECL overlay for a few quarters after a storm.
Risk-Adjusted Net Charge-offs
NCO (PD x LGD) as a function of Spero Portfolio Risk Measure
Another way to visualize net charge-offs is through the interactive heatmap below, which reinforces the conclusions we came to from our scatterplot above. Note that observation counts can vary from tile to tile, and ranges with less than 10k observations are filtered out.
Footnotes
2. Texas Commission on Environmental Quality (TCEQ) After-Action Review Report; USGS Post-Harvey Flood Documentation ↑
3. FEMA Impact Analysis; Prevention Web Disaster Recovery Documentation ↑
4. FEMA Fact Sheet on Individual Assistance Programs (2025) ↑
5. Federal Reserve Bank of Dallas Heart of Texas Economic Research; Labor statistics analysis ↑
Hurricane Irma, Florida, 2017
August 30, 2017 – September 13, 2017
Irma’s Path
Striking Florida within days of Harvey hitting Texas, Irma made landfall in a state with a strong, post-recession economy and a healthy housing market with significant homeowner equity. Unlike Harvey’s concentrated rainfall, Irma’s impact was characterized by widespread and severe wind damage alongside flooding, creating a more complex insurance claim environment. While individual locations experienced less concentrated flooding than Harvey’s catastrophic rainfall events, Irma’s powerful winds caused substantial structural damage—from roof failures to shattered windows—which subsequently allowed rainwater penetration into homes.⁶
This multi-hazard damage pattern created a critical insurance coverage puzzle. Homeowners with both flood insurance and standard homeowners policies could theoretically file separate claims for flood damage (covered by flood insurance) and wind/water damage (covered by homeowners insurance). However, properties that lacked flood insurance but sustained both wind damage and subsequent interior water intrusion faced a significant coverage gap. While homeowners insurance typically covers rain damage entering through wind-damaged roofing or broken windows, the distinction between “flood” and “wind-driven rain” can be contentious, and some policies exclude or limit coverage for water damage following wind events.⁷ This insurance complexity—along with more effective post-crisis forbearance programs and FEMA assistance—likely contributed to the lower loss rates we observe in the Fannie Mae data, since borrowers had multiple pathways to financial recovery even when facing severe physical damage.
As with Harvey, we visually inspected a map of Irma’s flooding and determined the path and non-path locations. Irma’s flooding was more dispersed than Harvey’s, and others may reasonably draw different path boundaries. Our path (red) encompasses roughly South Florida, below Tampa Bay.
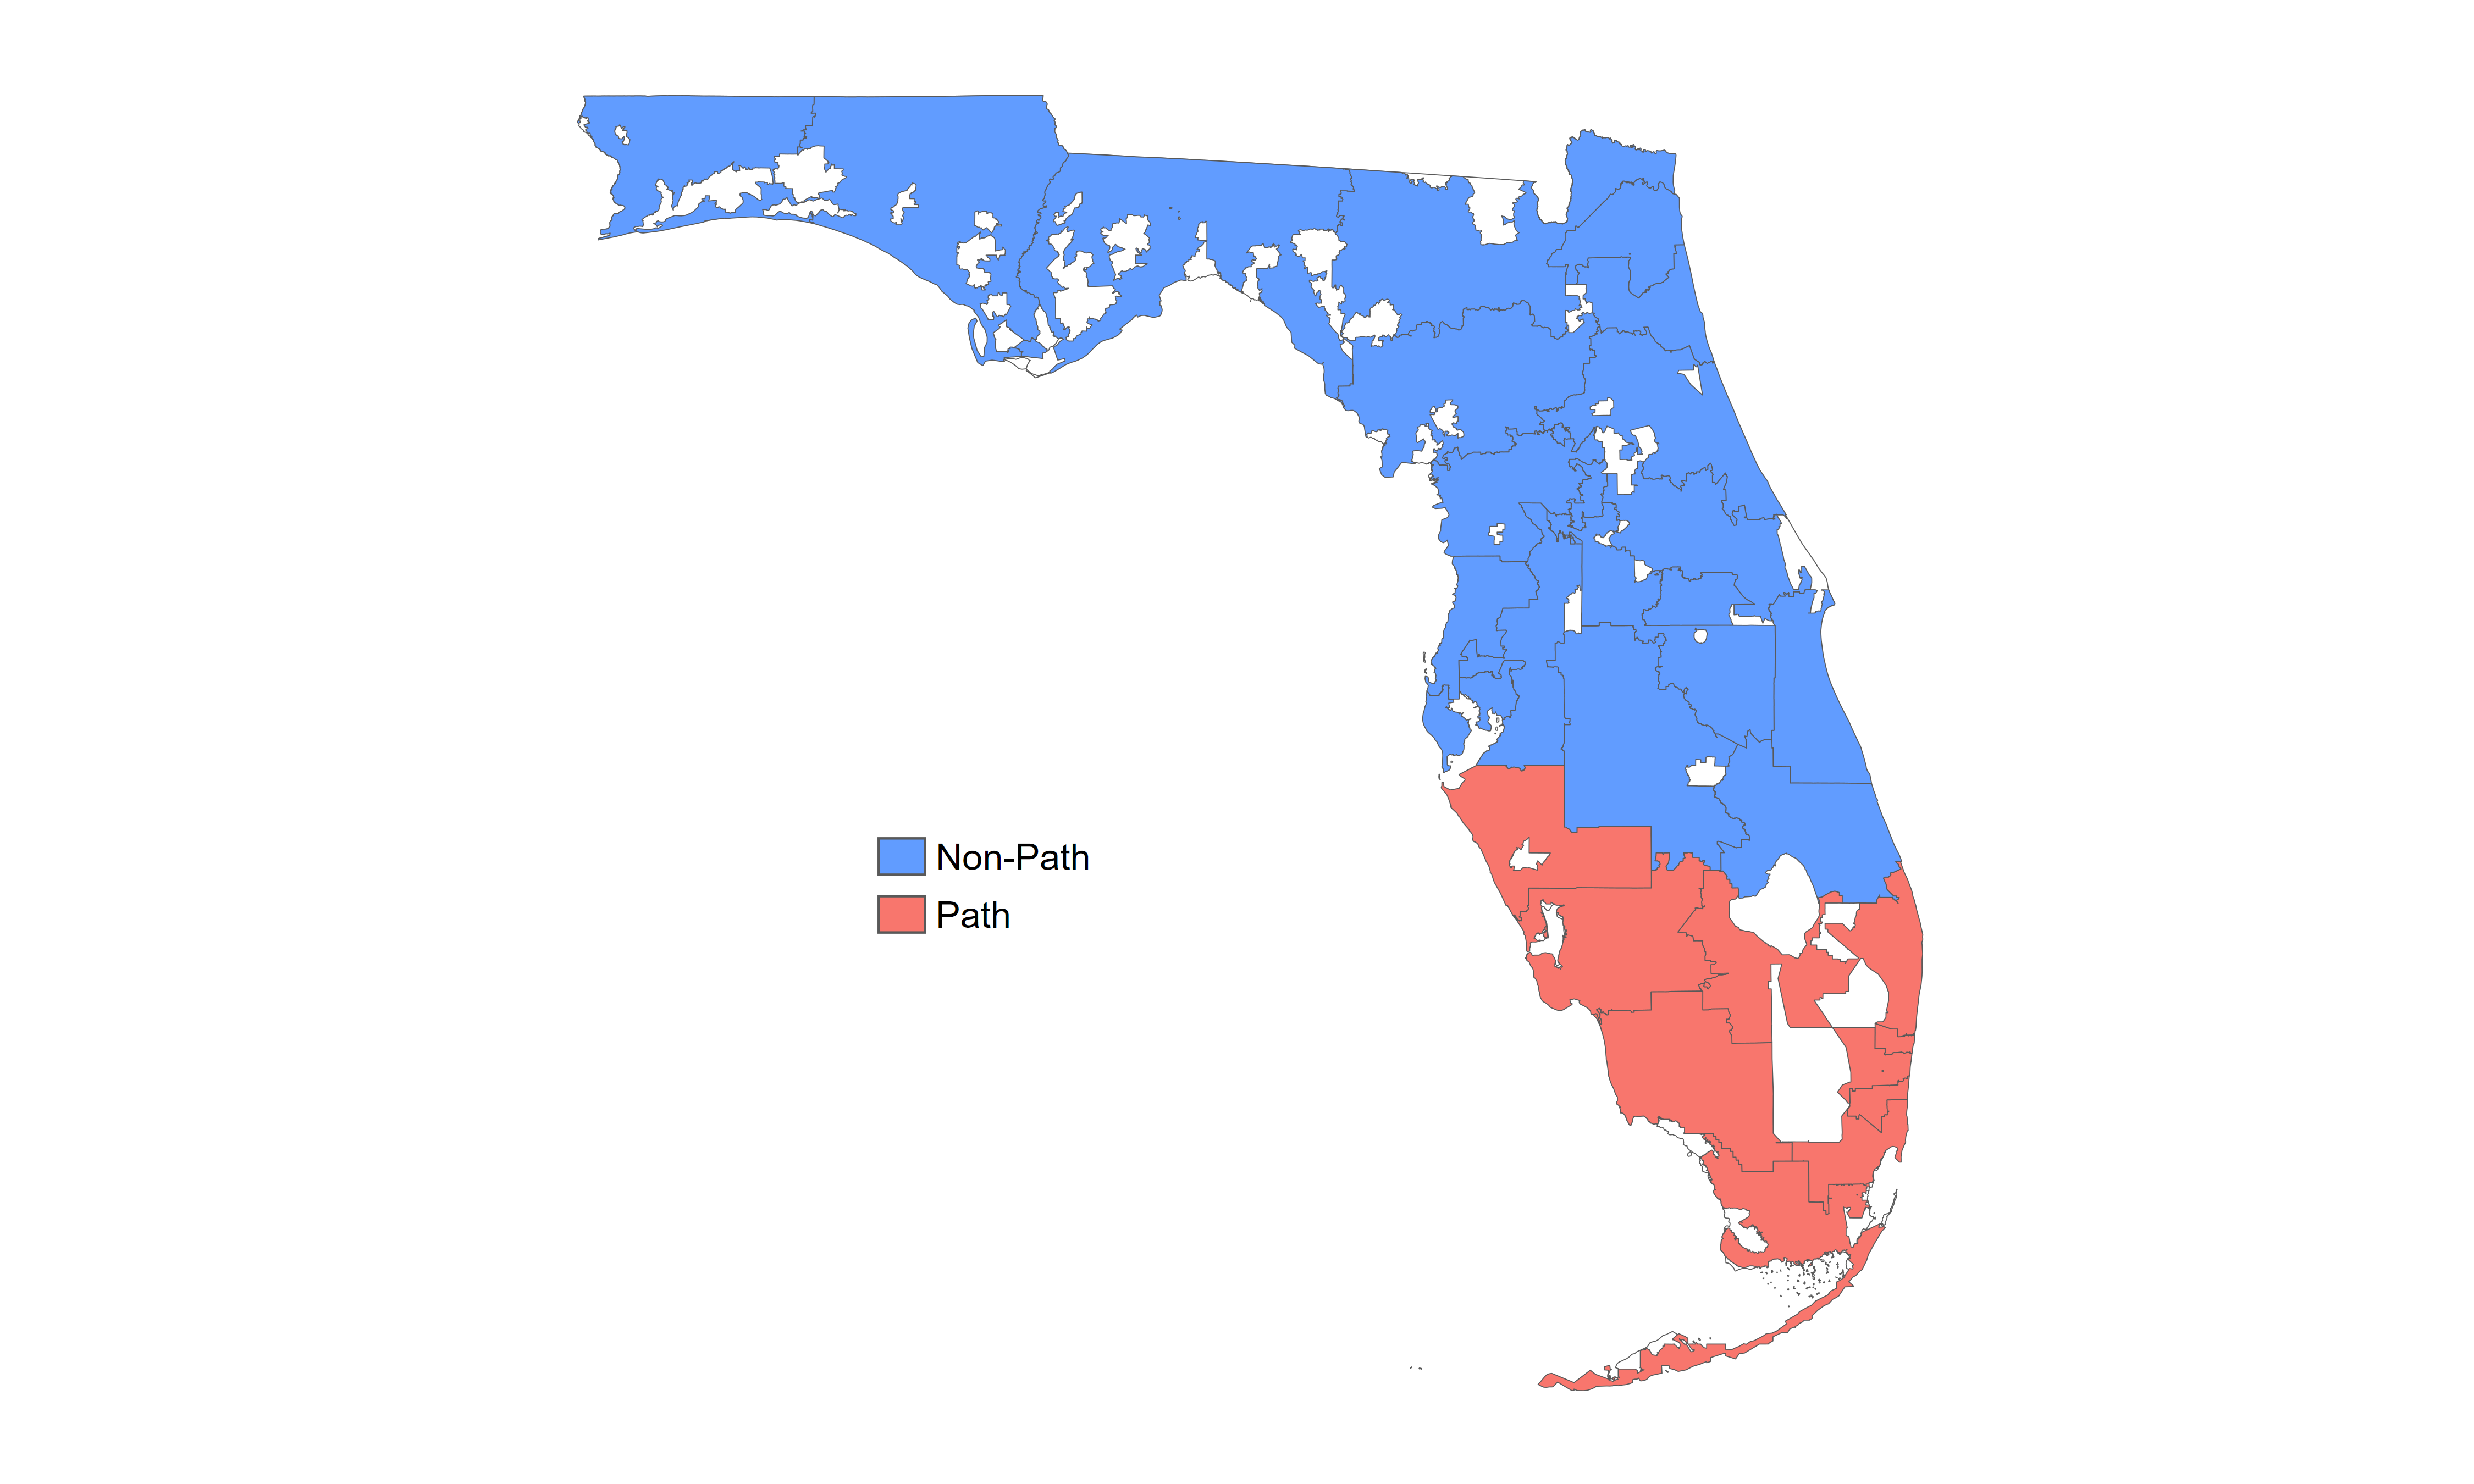
Irma Path Counties
Florida counties classified as in-path vs. non-path areas
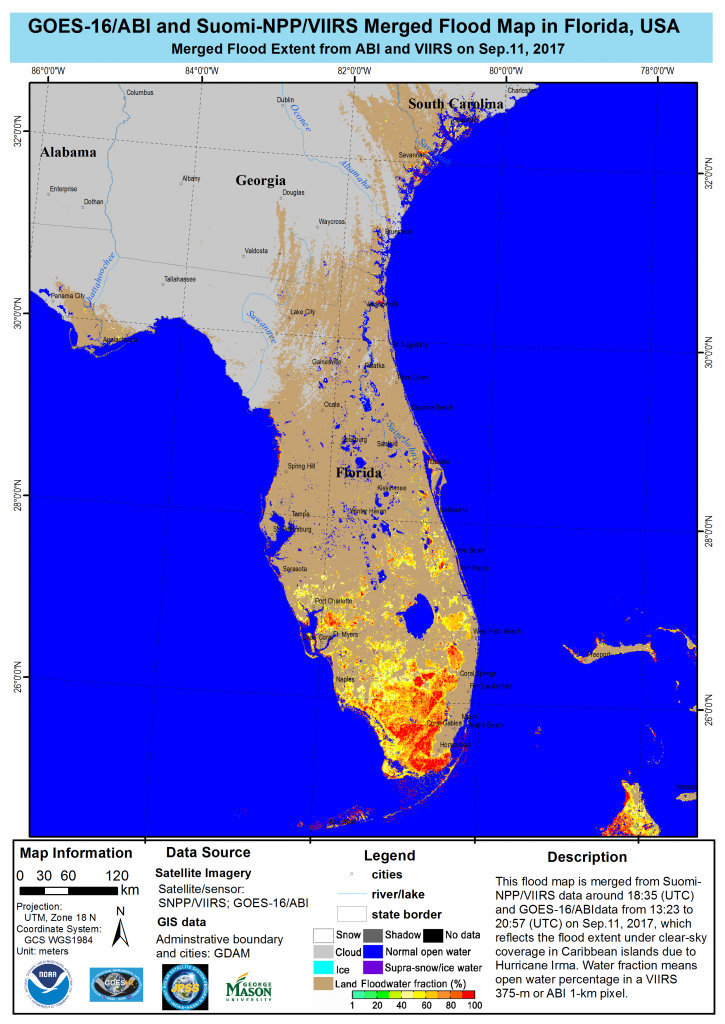
Irma Flooding Map
South Florida flooding pattern showing dispersed impact areas
Default Rates in Florida through Time
Like we did with Texas, we plot default rates by time and category, this time for Florida. However, unlike Harvey, we observe higher default rates outside of the defined path. Perhaps we should have selected more counties as being within the path, but we have proceeded with our original classification (from a previous version of this article) for consistency in the analysis.
Those in our path comprise 40% of all observations in Florida during Irma, while observations in our Harvey path only contained only 30% of Texas observations in the Fannie Mae Resi dataset. This provides an indication of the challenge of differentiating path vs. non-path in FL compared to TX. Moreover, as you’ll see, it doesn’t really matter in this case.
We found it interesting that default rates for Irmas path are the same magnitiude larger when compared to hurricane-free/crisis-free times as Hurricane Harvey (7x larger), but the same can not be said for a crisis comparision. Irmas path default rates are only ~1.2x crisis default rates in Florida (meaning that hurricane-free/crisis free times were about 1/5 the default rate of average crisis default rates), versus Harveys 4x crisis default rates in Texas (where the crisis default rates were ~1.75x hurricane-free/crisis-free rates.)
Default Rates Through Time
Default rates for hurricane path (red), non-path (blue), Florida-wide hurricane-free/crisis-free periods (green), and Florida-wide financial crisis period (orange).
Comparison of Risk-adjusted Default Rates
Consistent with the above time series, we see that path default rates uniformly exceed non-path rates, which uniformly exceed hurricane-free rates, when adjusted for risk.
Notice the nice, increasing, convex function formed by the green dots; that’s why we like our Spero Portfolio Risk Measure (see next paragraph). Also notice that if observations in the red and blue dots were grouped with the green dots, the relationship would be weaker, and that’s why we control for them. Average default rates for the hurricane path were 7x’s hurricane-free/crisis-free defaults, larger than crisis period default rates, which were 5.7x’s hurricane-free/crisis-free defaults.
While risk can be measured across multiple dimensions such as FICO, LTV, and DTI, here, so as not to give away our secrets, we’re using what we’ll call the “Spero Portfolio Risk Measure.” Our methodology is transparent with clients – we do not provide “black box solutions” Click on “methodology” to learn more.
Risk-Adjusted Default Rates
Default Rates as a function of Spero Portfolio Risk Measure
Comparison of Risk-adjusted LGDs
As with Harvey in TX, with Irma in Florida we see that when we control for risk, LGDs in hurricane-free times exceed path and non-path LGDs. In fact, LGDs in Florida in the quarters immediately after Irma are basically zero.
Risk-Adjusted Loss Given Default
LGD as a function of Spero Portfolio Risk Measure
Comparison of Risk-adjusted Charge-off Rates
Well, regardless of how high default rates are—even if they are 100%—when you multiply them by LGDs of zero, it should be little surprise that overall loss rates are… basically zero. Here, when risk is controlled, path, non-path, and non-hurricane observations are indistinguishable from each other: almost nothing is lost until risk increases. Hurricane NCO’s are 0.19x hurricane-free/crisis-free times, and 0.01x crisis times (whereas crisis NCOs are nearly 25x hurricane-free/crisis-free periods.)
Risk-Adjusted Net Charge-offs
NCO (PD x LGD) as a function of Spero Portfolio Risk Measure
Given that overall loss rates are indistinguishable from each other in the relevant domain—about [35, 90] on the horizontal axis—there would be little justification for any type of hurricane-related overlay. However, for transparency and conceptual soundness, which we define as representational faithfulness and reliability, we would control for the differences in default rates and LGDs and forecast each based on the curves formed by the green dots in their respective graphs. Once again, notice the beautiful increasing convex function of charge-offs w.r.t. our risk measure using the interactive heatmap below.
Hurricane Sandy, Long Island, NY, 2012
October 22 – November 2, 2012
Sandy’s Path
Hurricane Sandy struck the Long Island, New York area in late October 2012, arriving at a critical moment in the nation’s housing recovery. The broader economy was still in the early, fragile stages of recovery from the 2008 Financial Crisis, and homeowner equity remained depressed across the region. Unlike the robust housing markets that characterized the 2017 and 2022 hurricane seasons in the South and Southeast, the New York housing market lacked momentum, pricing strength, and the significant equity buffers that would later protect borrowers through subsequent disasters.
Sandy’s primary destructive mechanism was extreme storm surge, which pushed unprecedented ocean water levels into densely populated coastal communities. The region experienced storm surge heights of 8 to 11 feet above normal tidal levels in most areas, reaching as high as 13-14 feet in Staten Island.⁸ This surge-driven flooding inundated neighborhoods with saltwater that caused cascading damage to electrical systems, heating infrastructure, and structural foundations. In a high-cost urban environment where property values were substantial but equity was constrained, this surge-driven flooding created a particularly challenging recovery scenario. Damage extended far beyond individual homes—critical infrastructure including subway systems, power generation facilities, and transportation networks sustained severe disruption, amplifying economic dislocation across the region.⁹
To analyze the effect on mortgages in New York, we classified affected areas across Long Island based on storm surge maps and flooding reports, identifying those directly affected by Sandy’s path (shown in red on our maps) versus those outside the impact zone (shown in blue).
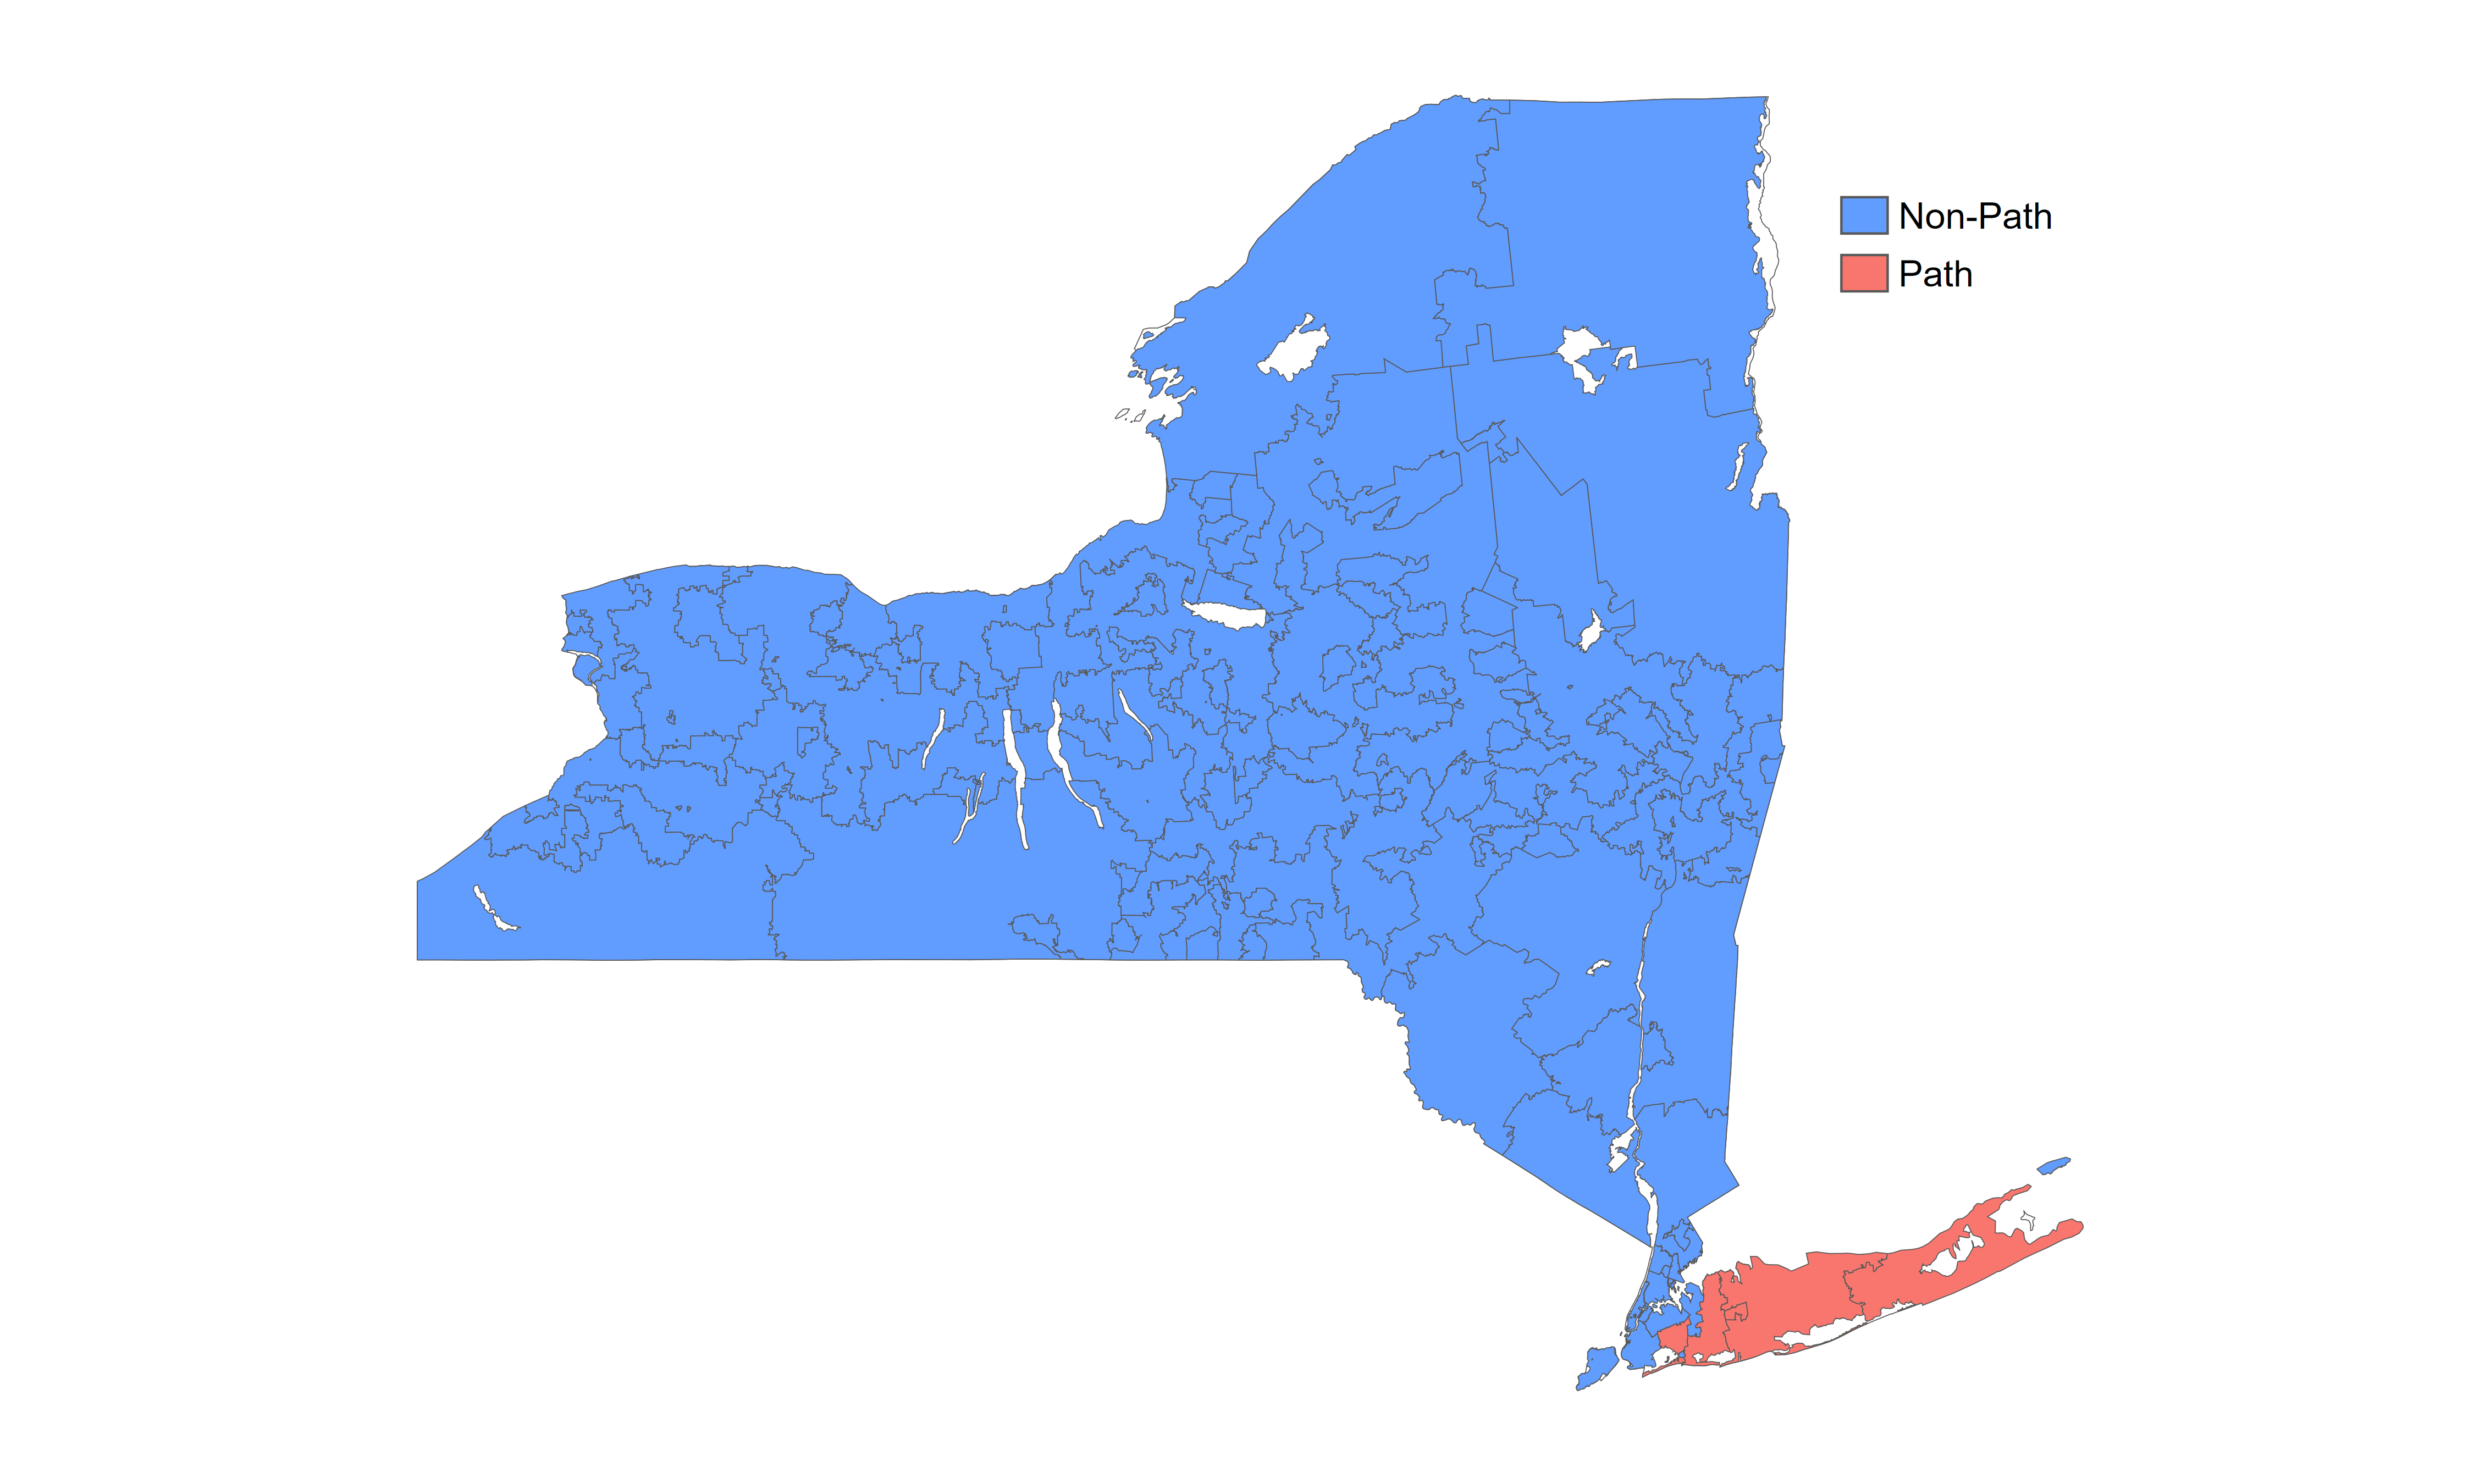
Sandy Path Map – New York
New York areas classified as in-path (red) vs. outside path (blue)
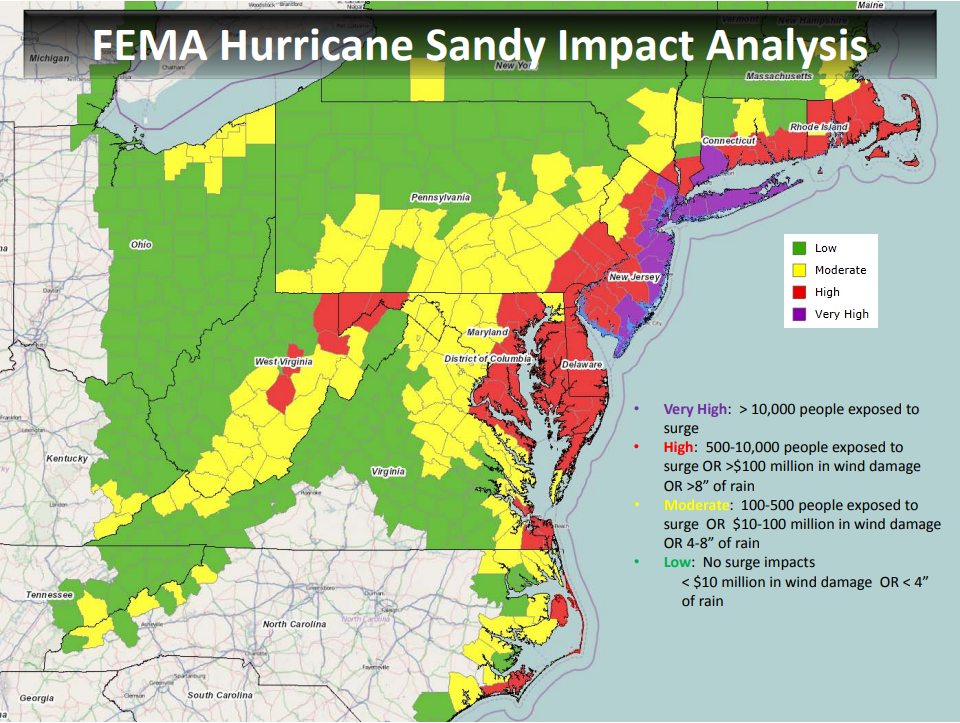
Sandy Storm Surge and Flooding
Storm surge impact across the New York coastal region
Default Rates in New York through Time
We identified quarters of elevated default rates following Sandy and compared them across three categories: hurricane path (red), non-path areas during those quarters (blue), and NY-wide hurricane-free/crisis-free periods (green).
Sandy’s effect on default rates shows patterns consistent with a post-crisis hurricane event. The analysis focuses on Long Island, where the storm’s effects were most concentrated. Default rates from the storm were about 2x default rates in hurricane-free/crisis-free times.
As with other analyses, we use the Spero Portfolio Risk Measure to control for risk differences across portfolios and time periods.
Default Rates Through Time
Default rates for hurricane path (red), non-path (blue), and NY-wide hurricane-free/crisis-free periods (green),
Comparison of Risk-adjusted Default Rates
When adjusted for risk, quarterly default rates within Sandy’s path show elevation compared to non-path areas. The green dots representing hurricane-free times demonstrate the expected convex relationship with our risk measure.
Sandy occurred in the end-of-crisis era, so we expect patterns more consistent with Harvey and Irma than with Katrina. However, we know that NY was still recovering from the crisis – so we may not see as large of a difference in LGD’s hurricane event and hurricane free times. Hurricane path default rates were ~1.8x higher than hurricane-free/crisis-free periods.
Risk-Adjusted Default Rates
Default Rates as a function of Spero Portfolio Risk Measure
Comparison of Risk-adjusted LGDs
Consistent with other post-crisis hurricanes, and despite the timing and generally lower number of observations when compared with other hurricane analyses, LGDs during Sandy show lower levels in the storm path compared to hurricane-free periods. This likely reflects insurance payouts, FEMA assistance, and forbearance programs that helped affected borrowers.
The pattern of reduced LGDs during hurricane periods appears to be a consistent feature of post-crisis storm responses.
Risk-Adjusted Loss Given Default
LGD as a function of Spero Portfolio Risk Measure
Comparison of Risk-adjusted Charge-off Rates
When default rates and LGDs are combined, Sandy’s overall charge-off impact appears minimal when properly adjusted for risk. The net effect shows patterns consistent with other post-crisis hurricanes, with overall losses remaining very low – only 1.2x larger than hurricane-free/crisis-free periods. Because Sandy happened towards the end of the crisis, we do not include crisis comparisons like we do for other weather events.
This reinforces our hypothesis that post-crisis regulatory reforms and improved loss mitigation lowered hurricane-related mortgage losses.
Risk-Adjusted Net Charge-offs
NCO (PD x LGD) as a function of Spero Portfolio Risk Measure
The interactive heatmap below provides an alternative visualization of net charge-offs, reinforcing the conclusions from our risk-adjusted analysis. Note that observation counts can vary from tile to tile, and ranges with less than 10k observations are filtered out.
Hurricane Katrina, Louisiana, 2005
August 23 – 29, 2005
Katrina’s Path
Hurricane Katrina, which struck Louisiana in August 2005, serves as the critical pre-crisis benchmark for understanding how regulatory frameworks and loss mitigation have transformed mortgage resilience. A Category 3 hurricane with 125 mph winds caused catastrophic flooding through widespread levee failures, displacing over 1 million residents and resulting in approximately 1,400 deaths.¹⁰ The convergence of three factors created conditions producing mortgage losses an order of magnitude higher than any post-crisis hurricane: a catastrophic natural disaster, weak underlying loan quality in the origination era, and primitive, inconsistently-applied loss mitigation tools.
The regulatory environment in 2005 was fundamentally different from the post-crisis world. Loan quality standards were weak, with widespread low-documentation originations and minimal equity requirements. When defaults occurred, loss mitigation options were primitive and inconsistently applied—there were no standardized, federally-mandated forbearance programs. The government and insurance response proved wholly inadequate: the National Flood Insurance Program was overwhelmed, private insurers faced insolvency, and FEMA assistance was slow and insufficient. Homeowners facing total loss had limited pathways to recovery—servicers offered little flexibility, insurance wouldn’t pay, and government aid came months or years later, if at all.
The housing market impact was severe. Entire neighborhoods experienced wholesale property loss, with values collapsed across affected parishes and permanent displacement of working- and middle-class families. Mortgage defaults inevitably converted to foreclosures and charge-offs at dramatically higher rates than post-crisis storms—reflecting weak equity, deteriorating collateral, overwhelmed borrowers, and minimal servicer flexibility.
To analyze the effect on mortgages across Louisiana, we classified areas based on flooding maps and storm impact reports, identifying those directly affected by Katrina’s path (shown in red on our maps) versus those outside the impact zone (shown in blue).
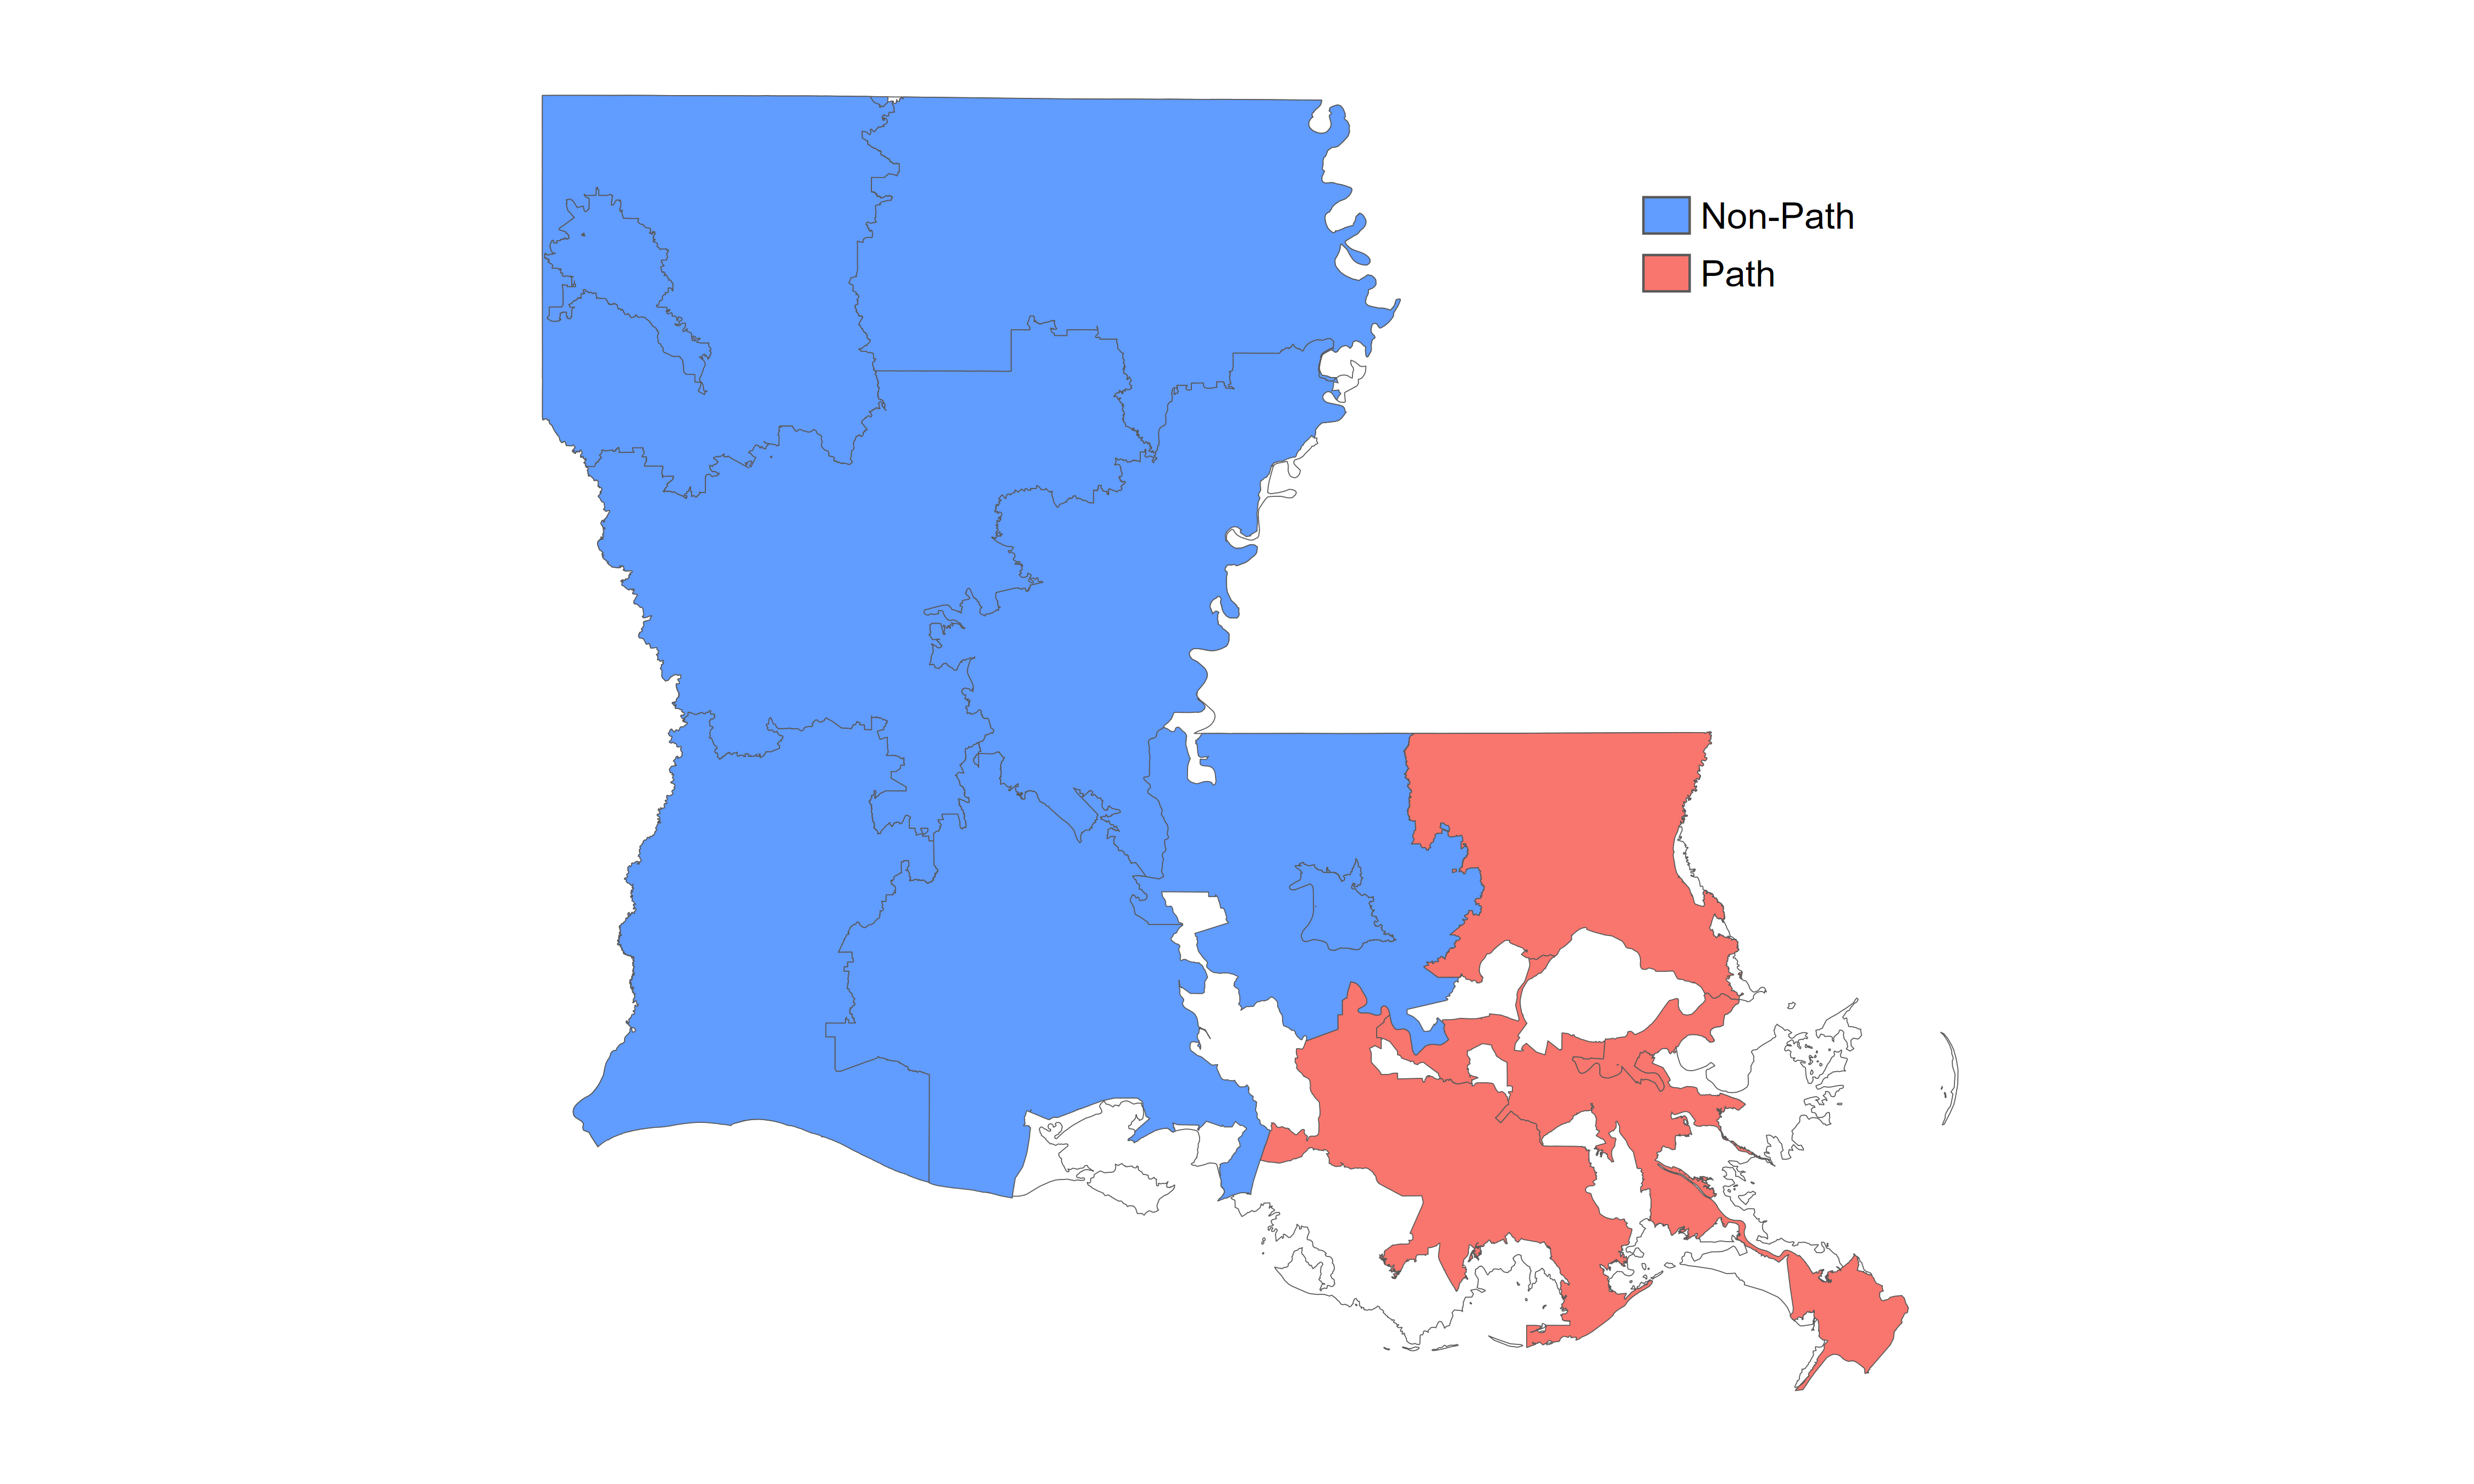
Katrina Path Map – Louisiana
Louisiana parishes identified as in-path (red) vs. non-path (blue)
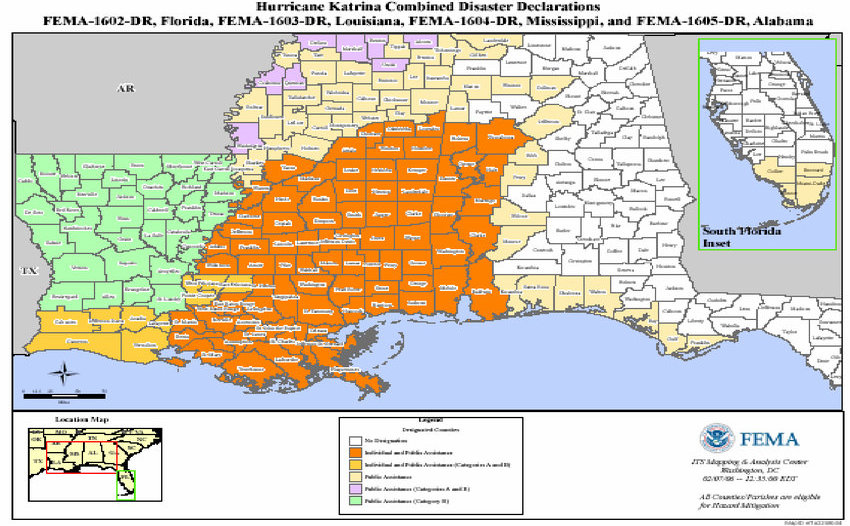
Katrina Flooding Map
Breakdown of affected Louisiana parishes
Default Rates in Louisiana through Time
Unlike many other events in our sample, Katrina occurred several years before the Financial Crisis and toward the beginning of our mortgage data history. Below we see peak default rates for Katrina to be immensely higher than the post crisis storms. We believe the relatively modest increase in Louisiana’s default rates during the crisis period, compared to the hurricane-free baseline, can be attributed to both storm damage and substantial population decline (New Orleans’s city population fell by an estimated 50% and metro fell by about 25%.) Default rates over the hurricane period were, on average, atleast 7x higher than the other events investigated (and, 37x higher than Hurricane Ian.)
Comparing average Lousina default rates shows a 3x increase from hurricane-free/crisis-free to crisis periods, which is tiny when compared to the 40x jump between hurricane-free/crisis free and the hurricane path.
Note the grey bars in 2016. We noted the spike in default rates while investigating Hurricane Katrina, and identified a flood that occured in 2016 in Louisiana.
Default Rates Through Time
Default rates for hurricane path (red), non-path (blue), LA-wide hurricane-free/crisis-free periods (green), and LA-wide financial crisis period (orange).
Comparison of Risk-adjusted Default Rates
We see that default rates for mortgages in the path greatly exceed non-path rates, which are barely higher than hurricane-free rates.
Like Harvey and Irma, we see a fairly strong (increasing) relationship for default rates as a function of risk for mortgages in the path. What’s striking here—compared to Texas or Florida—is that default rates for hurricane-free times don’t spike as dramatically as the risk measure increases. That’s partly a scaling effect, but it is also likely due to the fact that Katrina hit before the crisis, and Louisiana did not see the frothy, bubbly housing market that other Sunbelt states saw.
Risk-Adjusted Default Rates
Default Rates as a function of Spero Portfolio Risk Measure
Comparison of Risk-adjusted LGDs
As with the other hurricanes, we see that both hurricane/crisis-free and crisis-related LGDs show a sharper increase as our risk measure peaks, and exceed both path and non-path LGDs.
Risk-Adjusted Loss Given Default
LGD as a function of Spero Portfolio Risk Measure
Comparison of Risk-adjusted Charge-off Rates
Among non-Katrina events, Hurricane Sandy produced the largest NCO differential between hurricane and hurricane free/crisis free times at 1.18x, while other hurricanes exhibited no increase or lower NCOs. Katrina’s impact was substantially greater: hurricane NCOs exceeded hurricane-free/crisis-free NCOs by about 6.5x and crisis NCOs by about 2x.
The question arises: for a future hurricane, should one anticipate higher losses similar to Katrina, or much smaller differences like those observed for Harvey and Irma? (There was virtually no difference for Irma.) We would argue that following the financial crisis, both underwriting and servicing standards became stricter—both at Fannie Mae and at banks—so the 2017 storms are more representative of potential losses than the 2005 storm.
Risk-Adjusted Net Charge-offs
NCO (PD x LGD) as a function of Spero Portfolio Risk Measure
Do we have evidence of this? Yes, to some extent, and this involves a comparison of Louisiana flooding before and after the financial crisis. (The post-crisis storm was not as severe as Katrina—otherwise it would have received a memorable name.) We understand that one could make a convexity argument that losses grow disproportionately to factors such as wind speed or water depth, but the flooding did occur in some of the same parishes as Katrina, and it represents our best readily available comparison.
Another way to visualize net charge-offs is through the interactive heatmap below.
Footnotes
10. CDC/New England Journal of Medicine Peer-Reviewed Study; Louisiana Department of Health & Hospitals; National Hurricane Center; The Data Center (New Orleans Research Organization); Britannica; History.com ↑
Hurricane Katrina, Mississippi, 2005
August 23 – 29, 2005
Katrina’s Path
While Hurricane Katrina is often remembered for the levee failures in Louisiana, the Mississippi Gulf Coast experienced equally catastrophic devastation from a massive storm surge. The same Category 3 hurricane generated surge heights of 24 to 29 feet along the Mississippi coast, with a record high water mark of 27.8 feet recorded at Pass Christian—the highest storm surge ever recorded on the U.S. coast at that time.¹¹ This surge-driven destruction obliterated communities from Biloxi to Pass Christian, with entire residential blocks and commercial districts simply erased and surge penetrating as much as 6 miles inland in some locations.
The economic and regulatory context was identical to Louisiana: a pre-crisis environment with looser underwriting standards, lower equity requirements, and inadequate loss mitigation tools. When the disaster struck, the response mechanisms failed in the same ways—overwhelmed insurance, slow and insufficient government assistance, and servicers with no standardized protocols for helping distressed borrowers. Homeowners in Mississippi faced the same limited recovery pathways as those in Louisiana, with insufficient FEMA aid, inadequate insurance payouts, and minimal servicer flexibility.
The housing market impact mirrored Louisiana’s collapse. Coastal properties experienced total or near-total loss, values plummeted across affected counties, and permanent displacement fragmented communities. The combination of catastrophic physical destruction, weak pre-existing equity, and minimal financial support meant that mortgage defaults converted to charge-offs at similarly high rates—producing net losses comparable to Louisiana’s ~8 basis point outcome.
To analyze the effect on mortgages across Mississippi, we classified counties affected by Katrina’s path (shown in red on our maps) versus those outside the impact zone (shown in blue) based on storm surge and flooding reports.
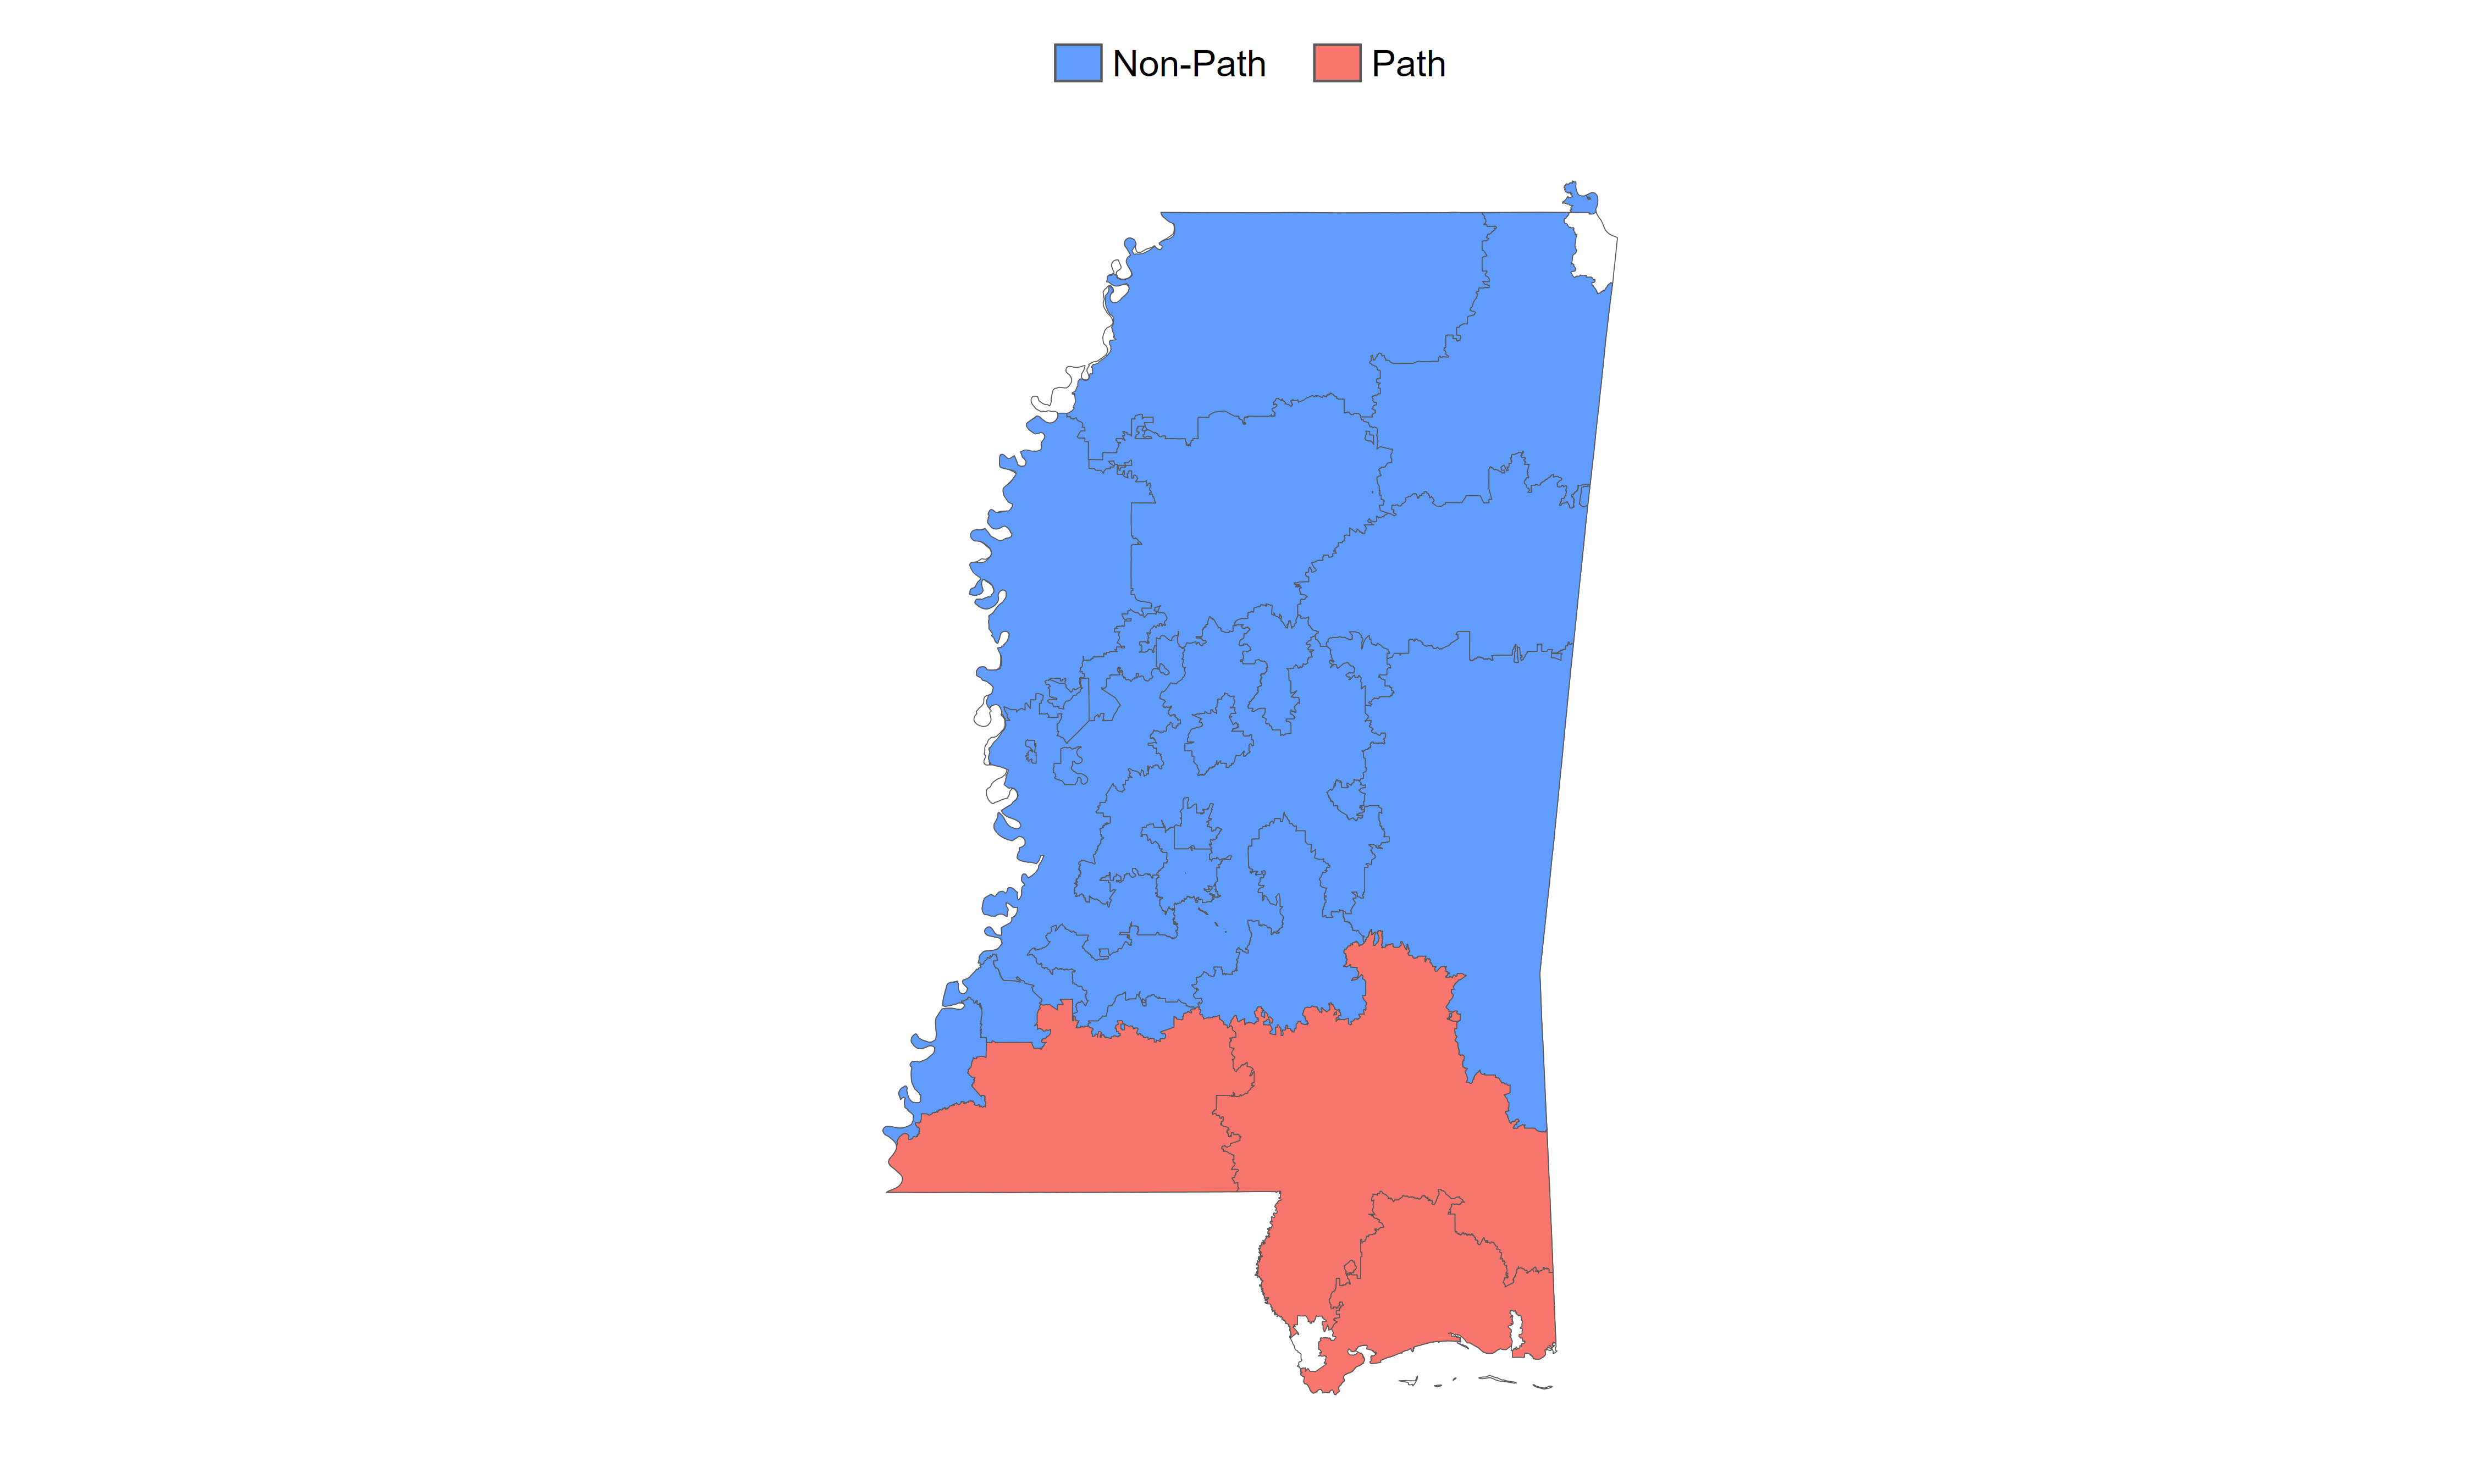
Katrina Impact Map – Mississippi
Mississippi counties affected by Hurricane Katrina flooding
County Classification
Path determination and assessment for Mississippi counties
Default Rates in Mississippi through Time
Below we see the a similar (slightly smaller) spike to Katrina in Louisiana. Like Irma and Katrina in LA, we see the blue non-path rates are a bit higher than the default rates in green, contiguous hurricane-free/crisis-free times; so, perhaps we should have widened the hurricane path – but we think the main affected areas are well covered.
Hurricane-impacted areas in Mississippi experienced default rates 23.5x higher than hurricane-free/crisis-free periods and a little over 12x the crisis period alone.
Default Rates Through Time
Default rates for hurricane path (red), non-path (blue), MS-wide hurricane-free/crisis-free periods (green), and MS-wide financial crisis period (orange).
Comparison of Risk-adjusted Default Rates
We come to the same conclusions we did for Katrina in Louisiana. Like Harvey and Irma, we see a fairly strong (increasing) relationship for default rates as a function of risk for mortgages in the path. Again, what is striking here compared to Texas or Florida—is that default rates for hurricane-free/crisis-free times don’t spike as dramatically as the risk measure increases. That’s partly a scaling effect, but it is also likely due to the fact that Katrina hit before the crisis, and Mississippi did not see the frothy, bubbly housing market that other Sunbelt states saw.
Risk-Adjusted Default Rates
Default Rates as a function of Spero Portfolio Risk Measure
Comparison of Risk-adjusted LGDs
LGDs in hurricane path areas were lower than in hurricane-free/crisis-free, crisis, and non-path periods—consistent with patterns observed in other analyses. Katrina’s unique characteristic was its extraordinarily high default rate, meaning that even with lower LGDs, net charge-offs remained elevated.
Risk-Adjusted Loss Given Default
LGD as a function of Spero Portfolio Risk Measure
Comparison of Risk-adjusted Charge-off Rates
We can ask the same question for Katrina in Mississippi that we did in Louisiana: for a future hurricane, should one anticipate higher losses, closer to Katrina, or much smaller differences, like those for Harvey and Irma? (There was absolutely no difference for Irma.) Katrina’s impact in MS was substantial: hurricane NCOs exceeded hurricane-free/crisis-free NCOs by about 7x and crisis NCOs by 1.5x.
Risk-Adjusted Net Charge-offs
NCO (PD x LGD) as a function of Spero Portfolio Risk Measure
Given (1) differences in underwriting and servicing standards pre-and post-crisis, and (2) evidence from the 2016 flooding, it’s not clear that Katrina’s higher loss rates would reoccur today or tomorrow. The interactive heatmap below provides additional perspective on these risk-adjusted charge-off patterns.
Footnotes
11. Wikipedia – Effects of Hurricane Katrina in Southeastern U.S.; NOAA National Hurricane Center; National Weather Service Mobile Office; WLOX News Analysis ↑
Flooding in Louisiana, 2016
August 2016
The Flood Zone
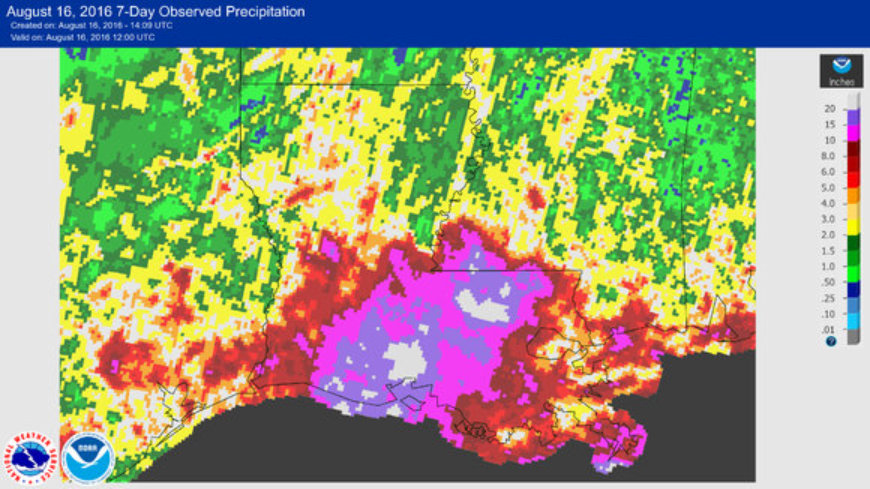
In August 2016, there was widespread flooding in Louisiana that caused a spike in defaults during Q4 2016 and Q1 2017. An intense, slow-moving weather system produced extraordinary rainfall across South Louisiana: some areas received 10-20 inches over 48 hours, with the hardest-hit areas experiencing 20-30 inches, and Livingston Parish recording 32 inches—an event designated by the National Weather Service as a “1,000-year” rainfall occurrence.¹² This unnamed 2016 flood was not a hurricane but nonetheless caused historic devastation, with over 90,000 homes damaged and over 28,000 people rescued from floodwaters.¹³
By 2016, the post-crisis framework was fully established. Mortgages originated since 2010 were subject to much stricter underwriting (Ability-to-Repay/QM rules). Furthermore, the disaster response playbook, including immediate forbearance and coordinated federal aid, was now standard operating procedure. Therefore, this flood event provides an interesting “apples-to-apples” comparison of a major flooding event in many of the same parishes devastated by Katrina a decade earlier, but under two vastly different regulatory regimes.
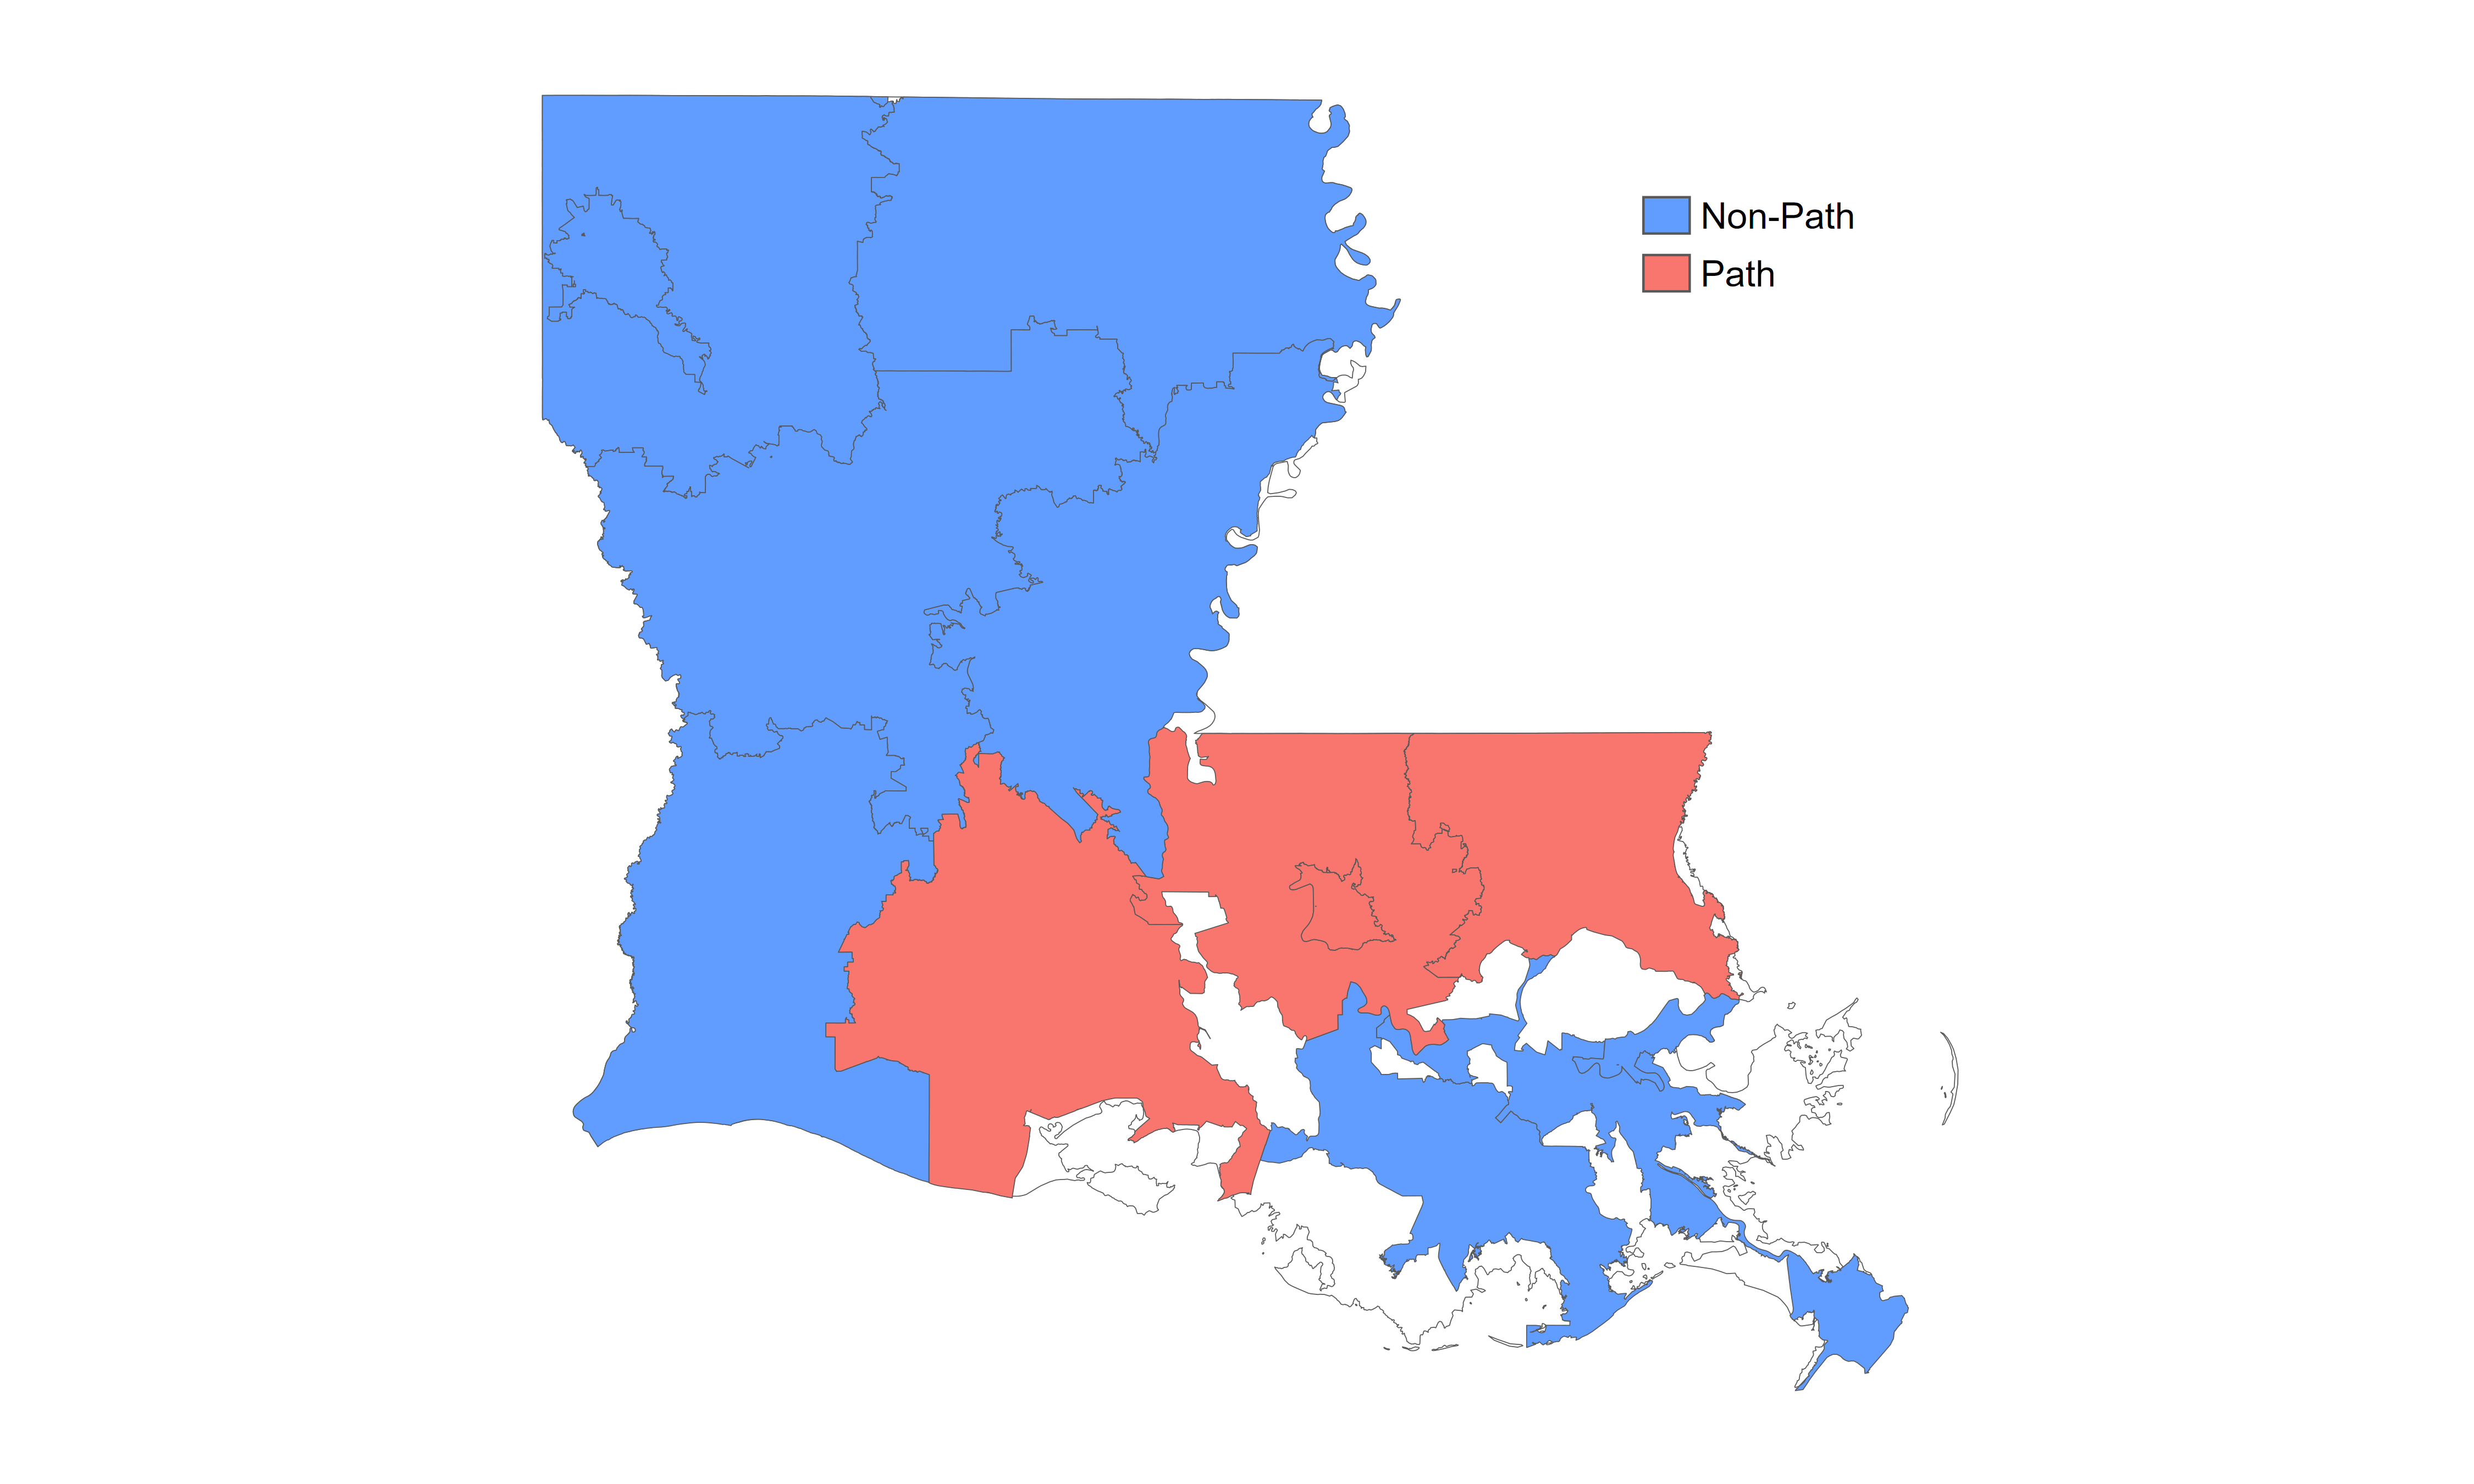
2016 Louisiana Flooding Map
Flood Effect Analysis
Default Rates in Louisiana through Time
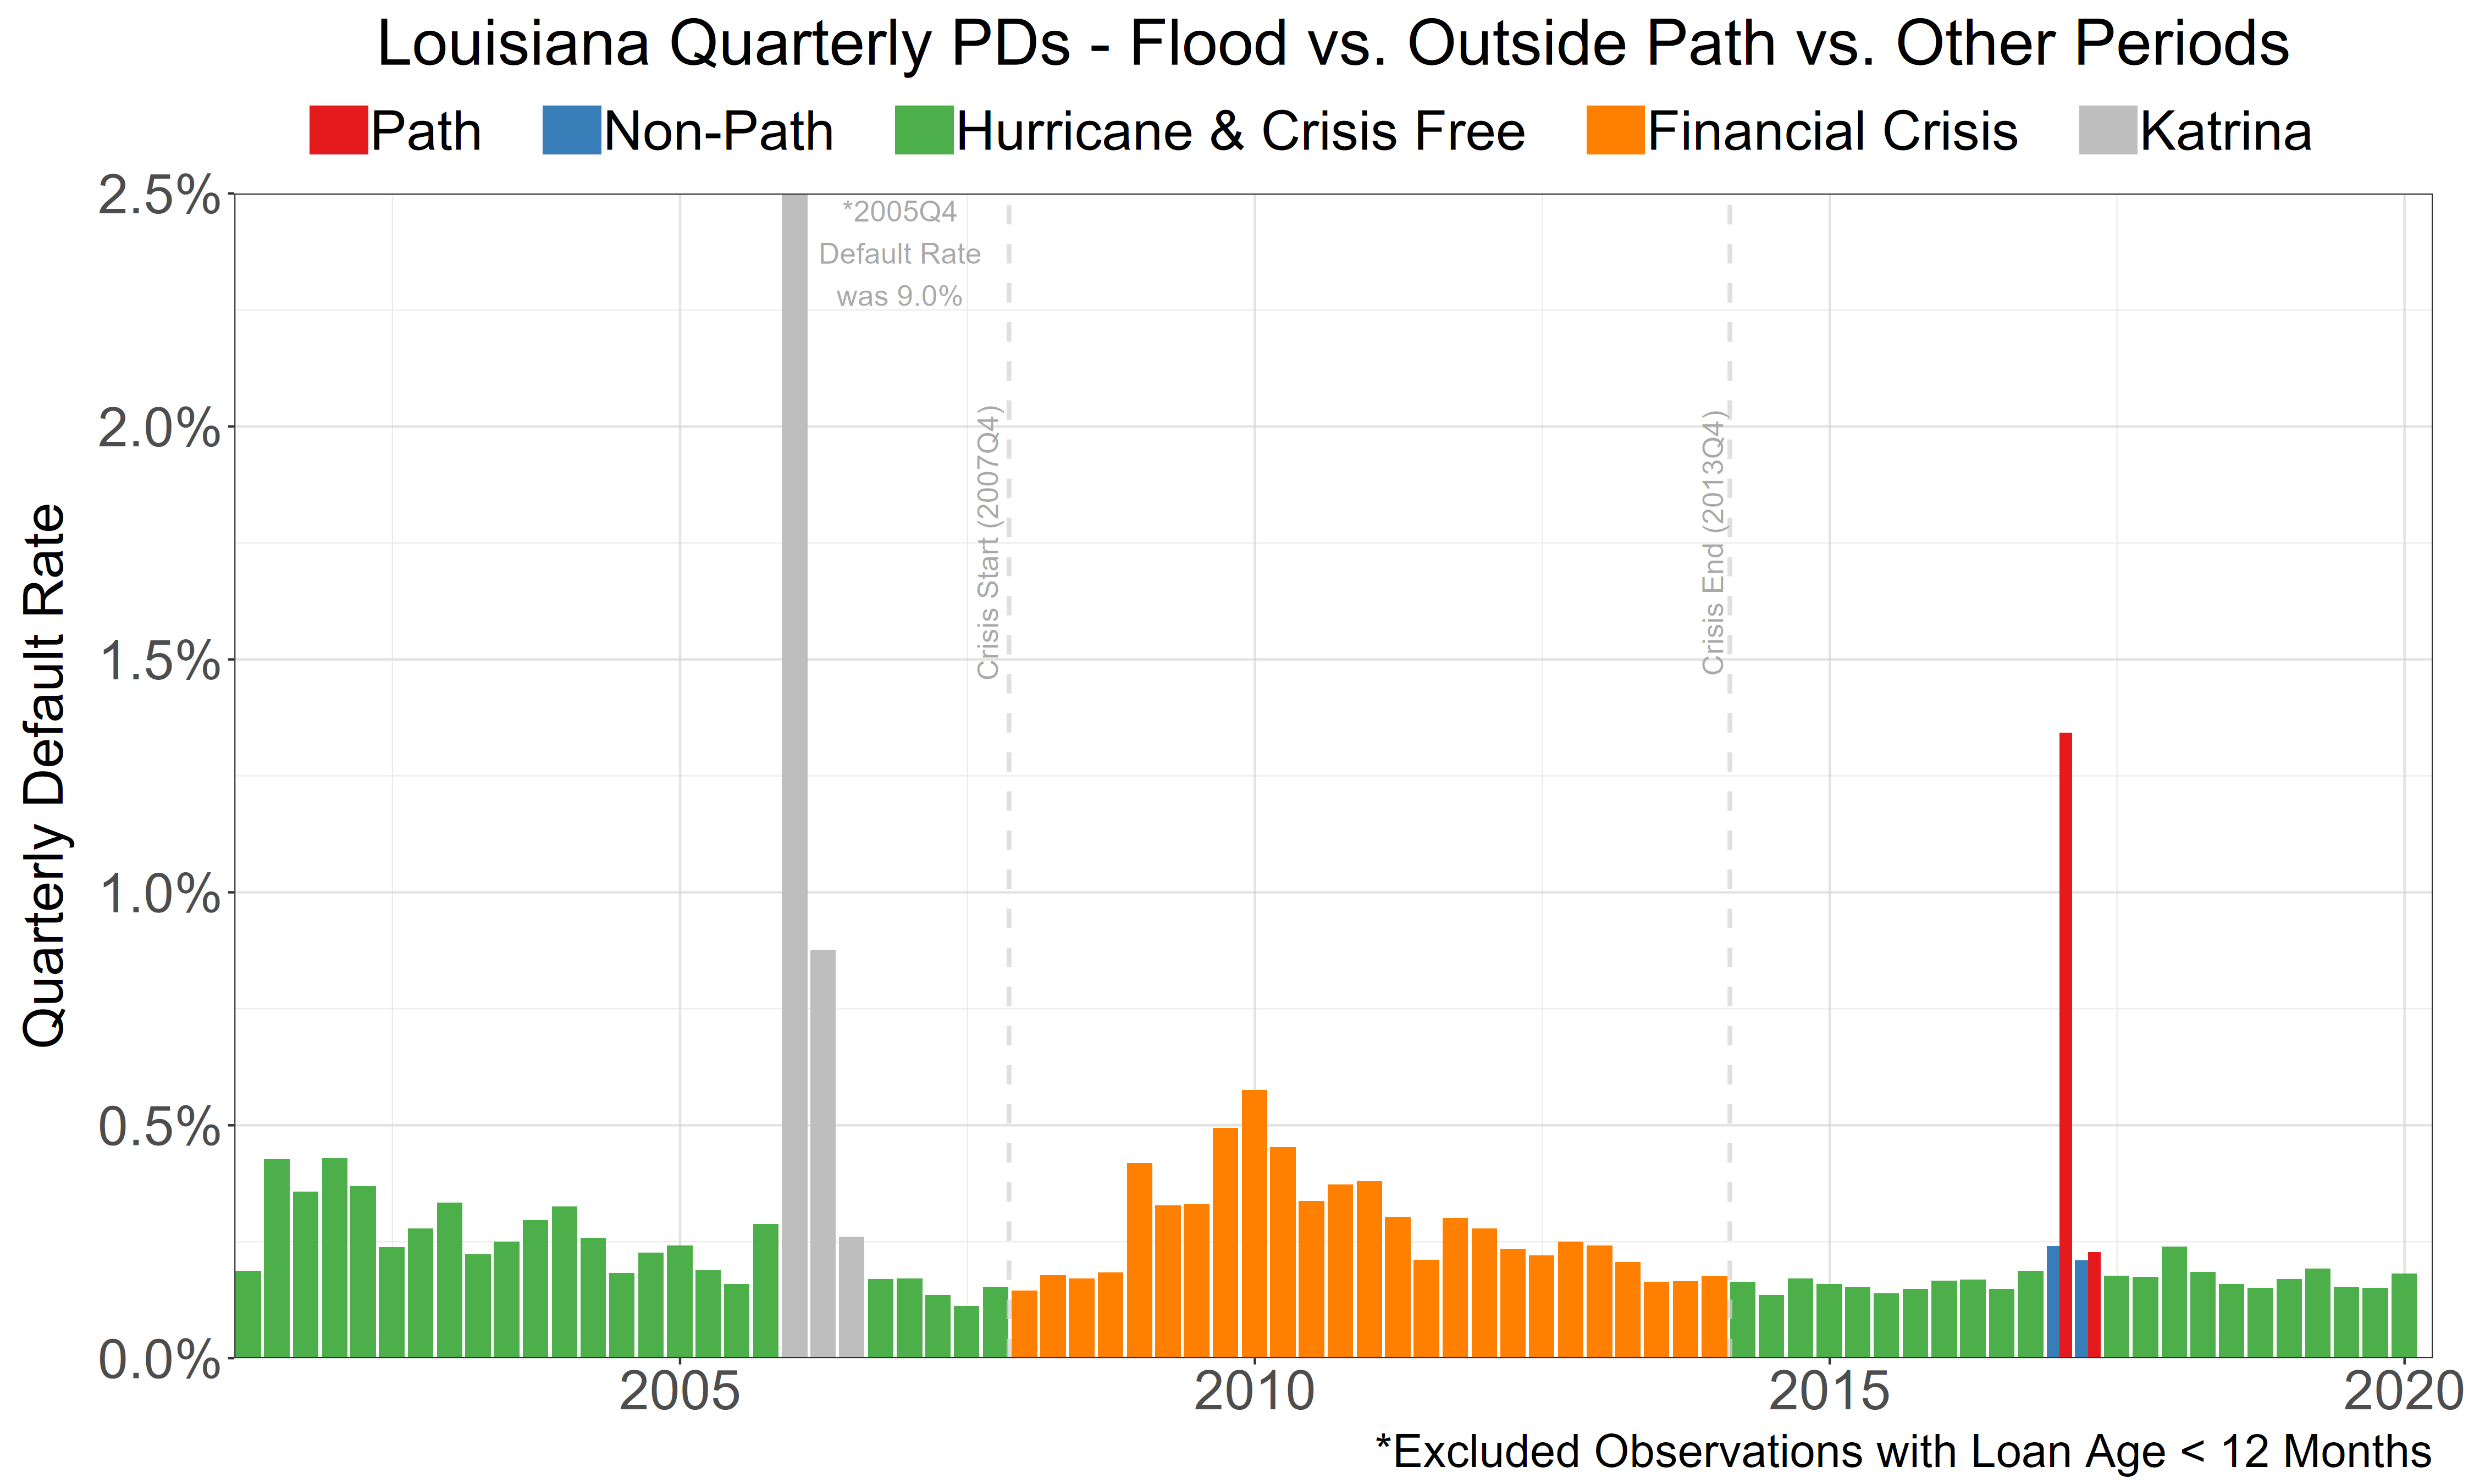
Here, it seems like we did a good job capturing the flooded area by parish as the blue bars on the right are close to the surrounding green ones. The comparison worth noting here is that the worse quarter for 2016 default rates was almost twice the peak of crisis-related default rates in 2010. We know that’s not true across the crisis; it is only a single quarter, but it is still striking.
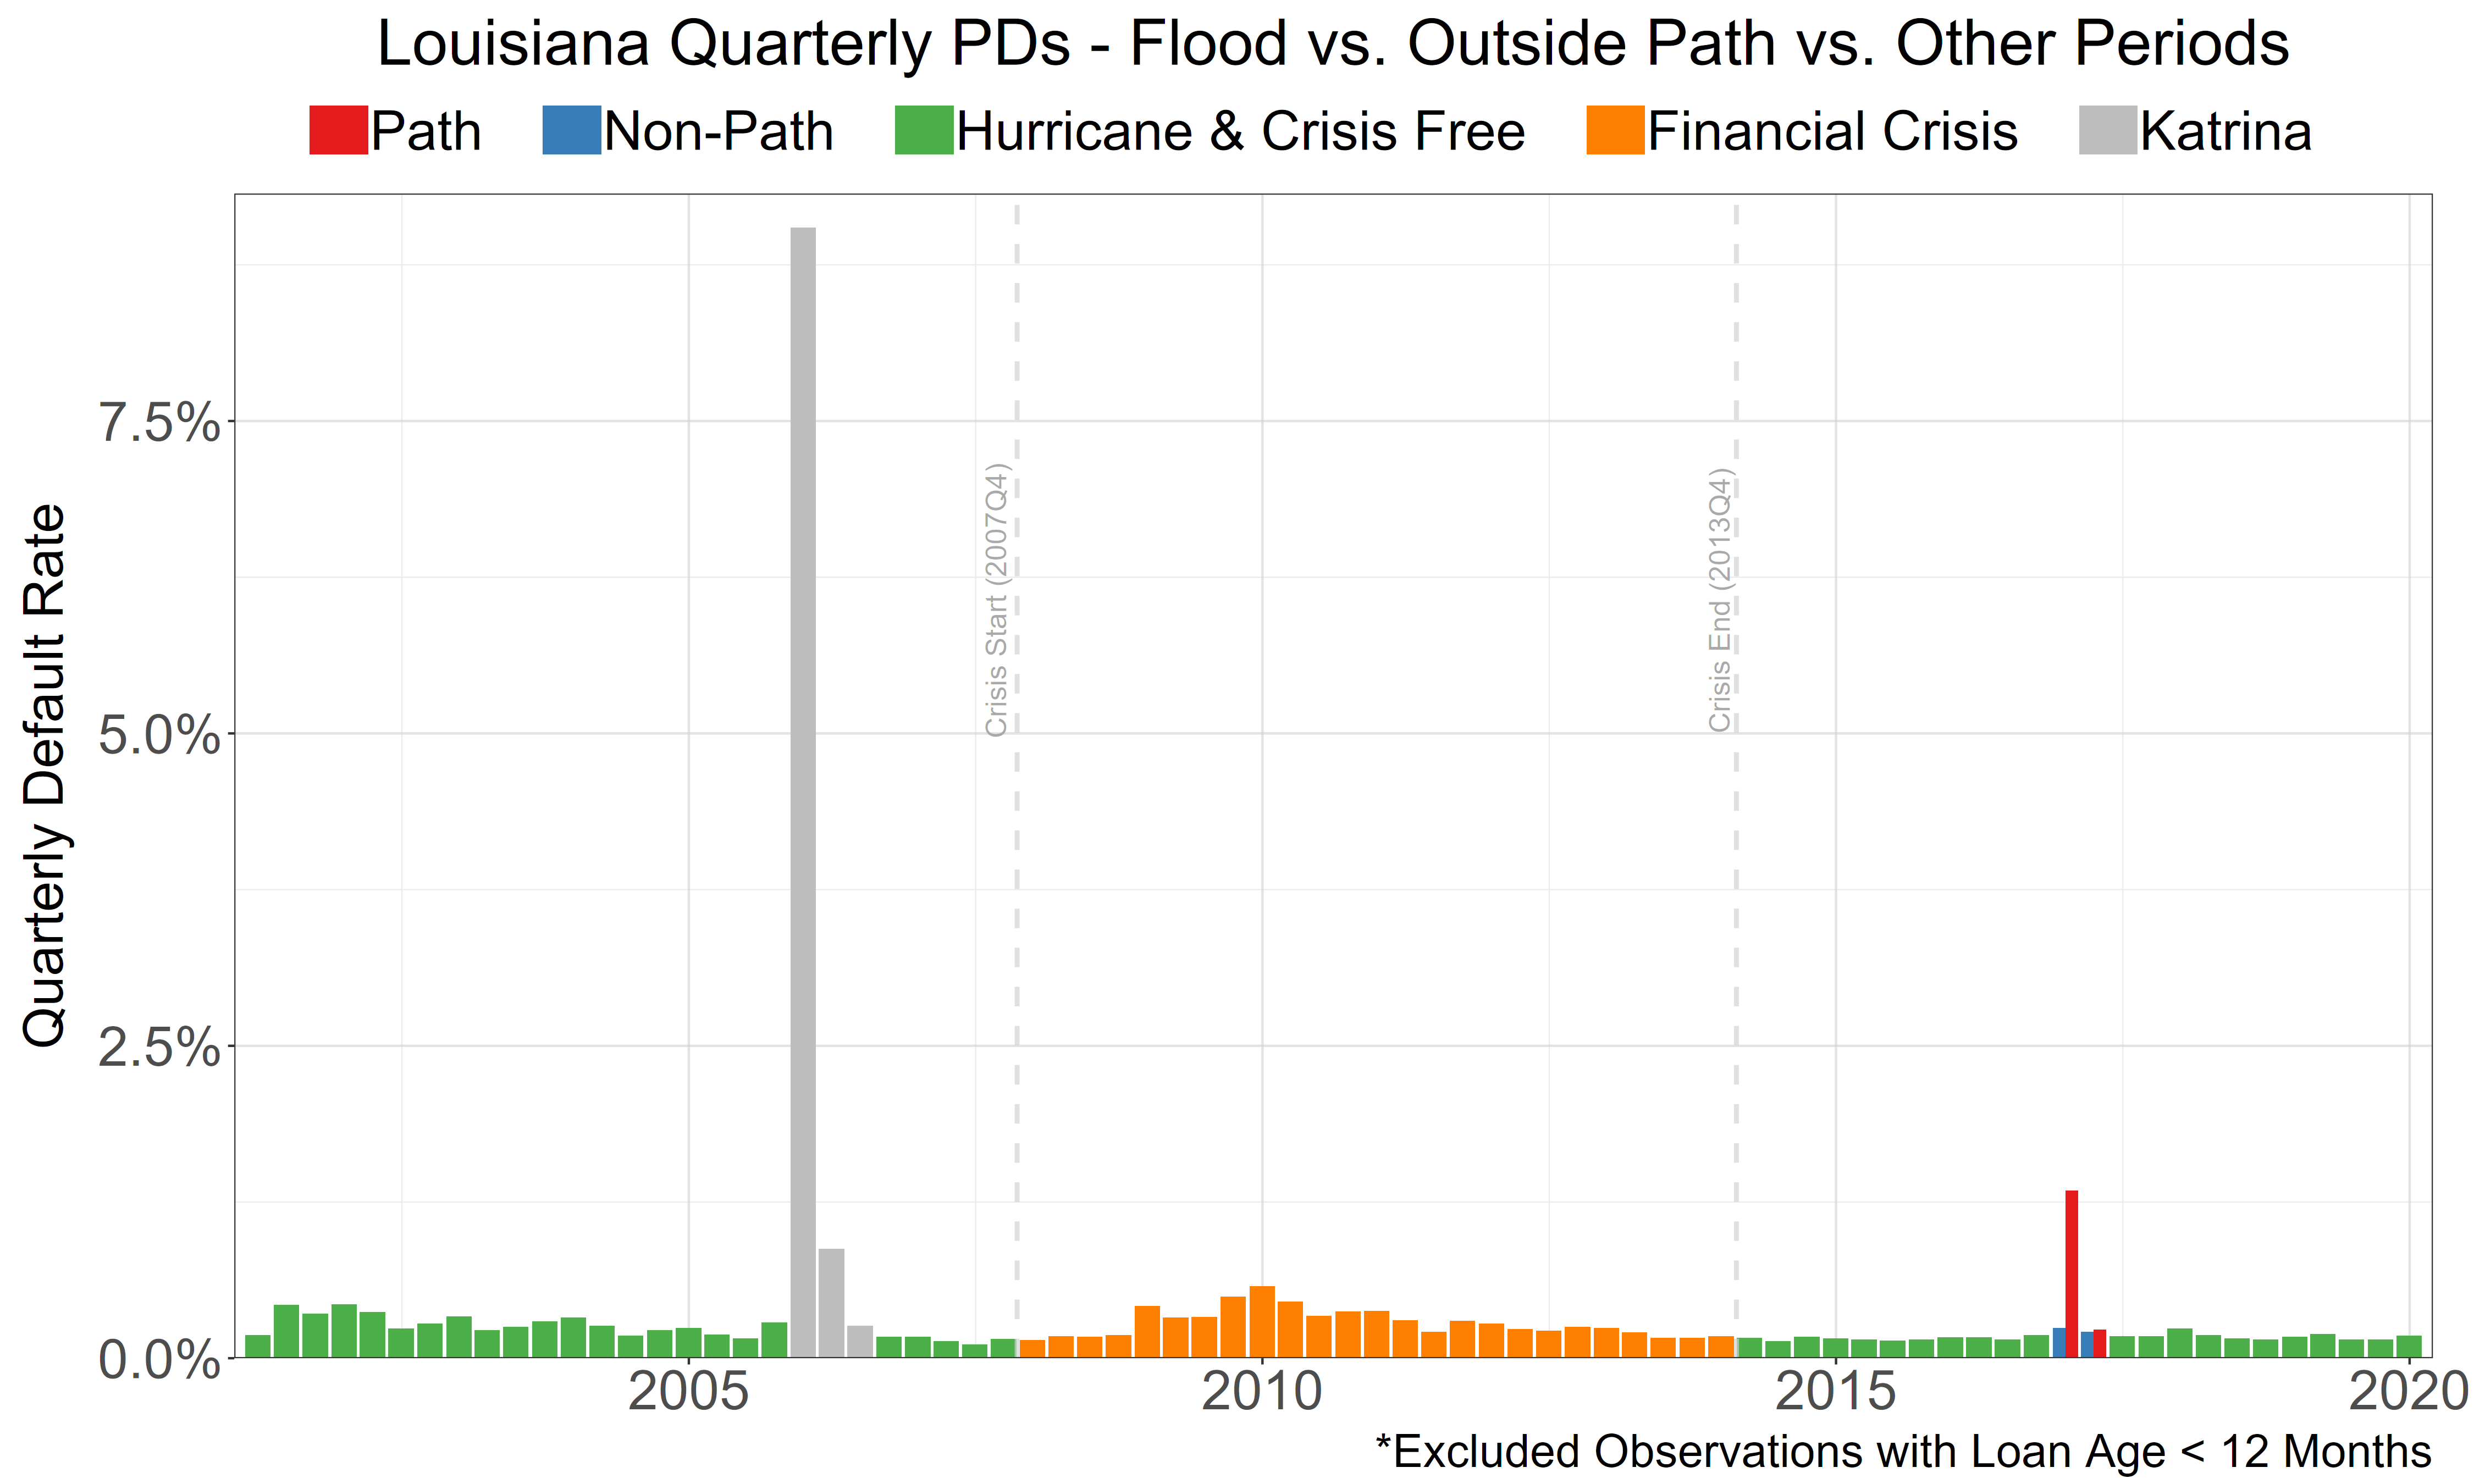
Note on scale: When viewed on the same scale as Katrina (shown in the left chart below), the 2016 flooding might appear as merely a “blip on the radar.” However, this perspective is misleading—the 2016 flooding spike was actually more significant than Financial Crisis peaks in Louisiana. The scaled comparison (right chart) reveals the true magnitude of this post-crisis event.
Default Rates Through Time (Katrina Scale)
The 2016 event appears minor when scaled to Katrina’s magnitude. Default rates for flood zone (red), non-flood zone (blue), Katrina path (grey), LA-wide hurricane-free/crisis-free periods (green), and LA-wide financial crisis period (orange).
Default Rates Through Time (Scaled to 2016)
Default rates for flood zone (red), non-flood zone (blue), Katrina path (grey), LA-wide hurricane-free/crisis-free periods (green), and LA-wide financial crisis period (orange).
Comparison of Risk-adjusted Default Rates
As with the hurricanes, we see that default rates for mortgages in the path greatly exceed those not in the path, which are about the same as observation in hurricane-and-flood-free times.
Within the flood zone, default rates are non-monotonic with our generic risk measure because of the red point to the left. We still see the anticipated convex relationship between our risk measure and defaults during “normal times.”
Average default rates for path areas exceed non-path areas by 3-4x in basis points. Visual inspection of the scatter plot corroborates this finding, with flood zone default rates approximately 3x higher than the remaining categories on a risk-adjusted basis.
Risk-Adjusted Default Rates
Comparison of Risk-adjusted LGDs
Once again, we see that LGDs during normal weather substantially exceed those in the flood zone—a cursory glance says by about a factor of three when adjusted for risk.
Risk-Adjusted Loss Given Default
Comparison of Risk-adjusted Charge-off Rates
The 2016 flood caused a severe spike in defaults (3x normal), demonstrating it was a genuinely damaging event. However, the outcome could not have been more different from Katrina. The combination of higher-quality underlying mortgages and effective loss mitigation completely offset the rise in defaults. LGDs were suppressed so effectively that the final net loss impact was zero. Flood NCO’s were one-third of rates during the crisis in Louisiana, a stark comparsion to what Katrina was – alittle over double rates during the crisis.
Risk-Adjusted Net Charge-offs
The interactive heatmap below reinforces the conclusions we drew from our scatterplot above, showing that risk-adjusted charge-off rates remain consistent across all three categories. Note that observation counts can vary from tile to tile, and ranges with less than 10k observations are filtered out.
Footnotes
12. National Weather Service Official Designation; Louisiana Economic Development Impact Report; Springer Academic Analysis of 2016 Floods; LSU Law Center Climate Change Policy Project ↑
13. FEMA Individual Assistance Records; Wikipedia 2016 Louisiana Floods; Louisiana Office of Community Development – Disaster Recovery; U.S. Geological Survey August 2016 Louisiana Floods Documentation ↑
Methodology Refresh
Analytical Methodology
For each event, we first defined the hurricane’s path and the duration of its influence, measured in quarters. We then segmented contemporaneous loans into three comparison categories: path (directly affected), non-path (geographically distant), and loans from hurricane-free periods.
Our comprehensive analysis compared four key dimensions. To ensure the validity of our conclusions, comparisons (B), (C), and (D) were conducted on a risk-adjusted basis using the Spero Portfolio Risk Measure:
- (A) Default rates over time.
- (B) Default rates across the three loan categories.
- (C) Losses Given Default (LGDs) across the categories.
- (D) Overall loss rates (net charge-offs) across the categories.
Defining Default and Timing
Consistent with standard banking practices, we defined default as loans ≥90 days past due. This definition is critical for timing considerations. Since the major events (Harvey, Katrina, Irma, and the Louisiana flood) occurred in late August or early September, elevated defaults or losses were not anticipated in the third quarter data. The total duration of a hurricane’s effect was determined by identifying the sequence of consecutive quarters that displayed abnormally high post-storm default rates.
Understanding the Four Analytical Dimensions
(A) Default Rates Over Time
We track quarterly default rates before, during, and after each hurricane event to identify the temporal pattern and duration of elevated defaults. This time series analysis helps establish the hurricane’s period of influence and provides the foundation for our subsequent analysis.
(B) Risk-Adjusted Default Rates
We compare default rates across path, non-path, and hurricane-free categories while controlling for portfolio risk using the Spero Portfolio Risk Measure. This ensures we’re comparing apples to apples when assessing hurricane impact. By adjusting for risk, we isolate the hurricane’s true impact from underlying portfolio composition effects.
(C) Risk-Adjusted Loss Given Default (LGD)
LGD measures the severity of loss when a default occurs. We’ve consistently found that hurricane-period LGDs are lower than normal-weather LGDs, likely due to insurance proceeds, FEMA assistance, forbearance programs, and in some cases strategic defaults where borrowers delay payments until assistance arrives.
(D) Overall Loss Rates (Net Charge-offs)
The bottom line: overall losses are calculated as Default Rate × LGD. This is where we see the dramatic difference between pre-crisis events like Katrina (update basis points) and post-crisis events like Irma (0 basis points). The offsetting mechanism—elevated defaults paired with suppressed LGDs—creates near-zero net losses despite massive default spikes.
The Spero Portfolio Risk Measure
While risk can be measured across multiple dimensions such as FICO, LTV, and DTI, we developed the Spero Portfolio Risk Measure—a proprietary metric that is robust, intuitive, and theoretically sound. Constructed on a loan-by-loan basis and then aggregated, it provides comprehensive portfolio or sub-portfolio assessments. Our methodology is transparent and explainable—never a black box solution.
Data Source and Scope
We used Fannie Mae’s publicly available mortgage loan data for our analysis. Our findings reflect the Fannie Mae Resi dataset and should not be directly applied to bank-held mortgages, portfolio loans, or other loan types without appropriate validation and adjustment for portfolio-specific characteristics.
Note that observation counts vary from analysis to analysis, and ranges with fewer than 10,000 observations are typically filtered to ensure statistical robustness.
Key Methodological Principles
- All comparisons control for loan-level risk using the Spero Portfolio Risk Measure to isolate hurricane effects.
- Defaults are defined as ≥90 days past due, consistent with standard banking industry practice.
- Hurricane period of influence is determined by identifying consecutive quarters of abnormally elevated default rates.
- Three comparison categories ensure valid apples-to-apples analysis: path-affected, non-path, and hurricane-free periods.
- Results focus on net charge-offs (Default Rate × LGD) to measure true economic impact on loan portfolios.
- Post-crisis period (2009+) shows dramatically improved loss mitigation compared to pre-crisis (pre-2008).
Sonia J. Summers painted Chrissy and Dexter’s dogs, Piper and Max. You can see more of her work at soniajacksonsummers.weebly.com.