There is a lot of talk about private credit’s (PC’s) current problems, much of it related to AI’s effect on borrowers in the software industry. While we’re sure those specific issues are real, it’s more likely that PC’s problems are broader and more systemic than the negative effects of technological innovation in one industry segment.1 We argue they result from the consequence of five separate factors coming together.
We love the line that appears early in The Hobbit, when the hobbit was hungry, wet, and tired, “Bilbo was sadly reflecting that adventures are not all pony-rides in May-sunshine…” We suspect that describes how a lot of PC managers feels these days. (Note: we’re using “PC” as a catch-all to refer to non-bank lending where debt financing is provided to companies by private investment funds or Non-Depository Financial Institutions (NDFIs) rather than traditional banks or public bond markets. Our definition includes Business Development Corporations (BDCs) that are publicly owned.)
The five factors we argue are at play:
- Initial Boost in Demand: after the crisis, the initial demand for PC arose to supplant banks as providers of risky loans that fell from regulatory favor. These loans were inherently riskier than most other bank loans, which is why regulators didn’t like them.
- Greater Incentive to Take Risks: PC’s “no-run” capital structure, which requires longer-term commitments by investors, allows (or indulges) increased risk-taking compared to banks.
- Credit Loss Patterns Follow Regimes: for most loan categories, there are either good times—evidenced by almost no credit losses—or bad times when loss rates are an order of magnitude or two greater than in good times. It’s during bad times that risky loans perform substantially worse than safe loans.
- A Short History of Good Times: during PC’s existence as a major asset class, favorable economic conditions have been the norm. Given its shorter history, PC’s long-term performance seems favorable to banks’ long-term performance. (Alas, it is a false comparison—it’s like why running downhill feels better than running uphill.)
- Accounting (or not) for Problems: banks have stricter rules in classifying loans as delinquent and in default. PC doesn’t face the same prodding, and the lack of recorded failures may mislead PC into believing its credit policies are superior, motivating increased lending to marginal borrowers.
1. Increased Demand for Private Credit
Private credit as a large, distinct asset class only emerged post-crisis. Before the early 2010s, middle-market direct lending by non-banks was very small. In fact, the most reliable historical data for the asset class doesn’t start until the early teens, when BDCs increased in number and size.
It was during that time that large banks retreated from providing credit to middle-market companies as a way for them to meet higher capital requirements and improve their risk-based capital ratios. As a result, many former bank customers turned to PC for financing.2
The market share shift has been dramatic: private credit now accounts for around 30 percent of debt issued by below-investment-grade-rated companies, up from 13 percent immediately following the crisis.3
2. Greater Incentive to Take Risks
PC’s no-run structure allows (or indulges) increased risk appetites compared to banks.
The basic argument is pretty simple, and results from each industry’s marginal (in a microeconomic sense) lending condition, i.e., where the marginal expected revenue derived from the next borrower equals marginal expected costs associated with making that loan. The likelihood of a run and the associated costs of one increase as banks make riskier loans. Those changing (marginal) expected costs affect lending decisions. Those costs may be financial costs or opportunity costs. (You might miss your honeymoon: ask George Bailey.) So, banks won’t make loans to borrowers below a threshold where a slight (marginal) decrease in credit quality would increase expected run costs more than the bank would benefit from the additional interest that could be charged.
Because PC investors commit their funds for a longer period, PC doesn’t have the same marginal expected cost of a run; so, that side of the equation is smaller. That means that PC has an incentive to go further down the credit spectrum, i.e., it has more incentive to lend to lesser-quality applicants below the bank’s threshold. Therefore, with all else equal, PC firms will have riskier portfolios than banks. The possibility of depositor runs disciplines banks but not PC funds.4
In sum, PC’s initial growth involved risky loans and, when compared to banks, PC has an ongoing incentive to make riskier loans. Ergo, PC portfolios are likely riskier than bank portfolios. But wait! How can that be… when nothing bad seemed to be happening for years?
3. Credit Loss Patterns Follow Regimes
Historically, PC losses have been de minimus. Here, we explain why that’s a sign of the times more than anything else. To do that, let’s consider a beautiful illustration of credit regimes: industry-wide bank net charge-offs of Commercial Real Estate (CRE) loans.
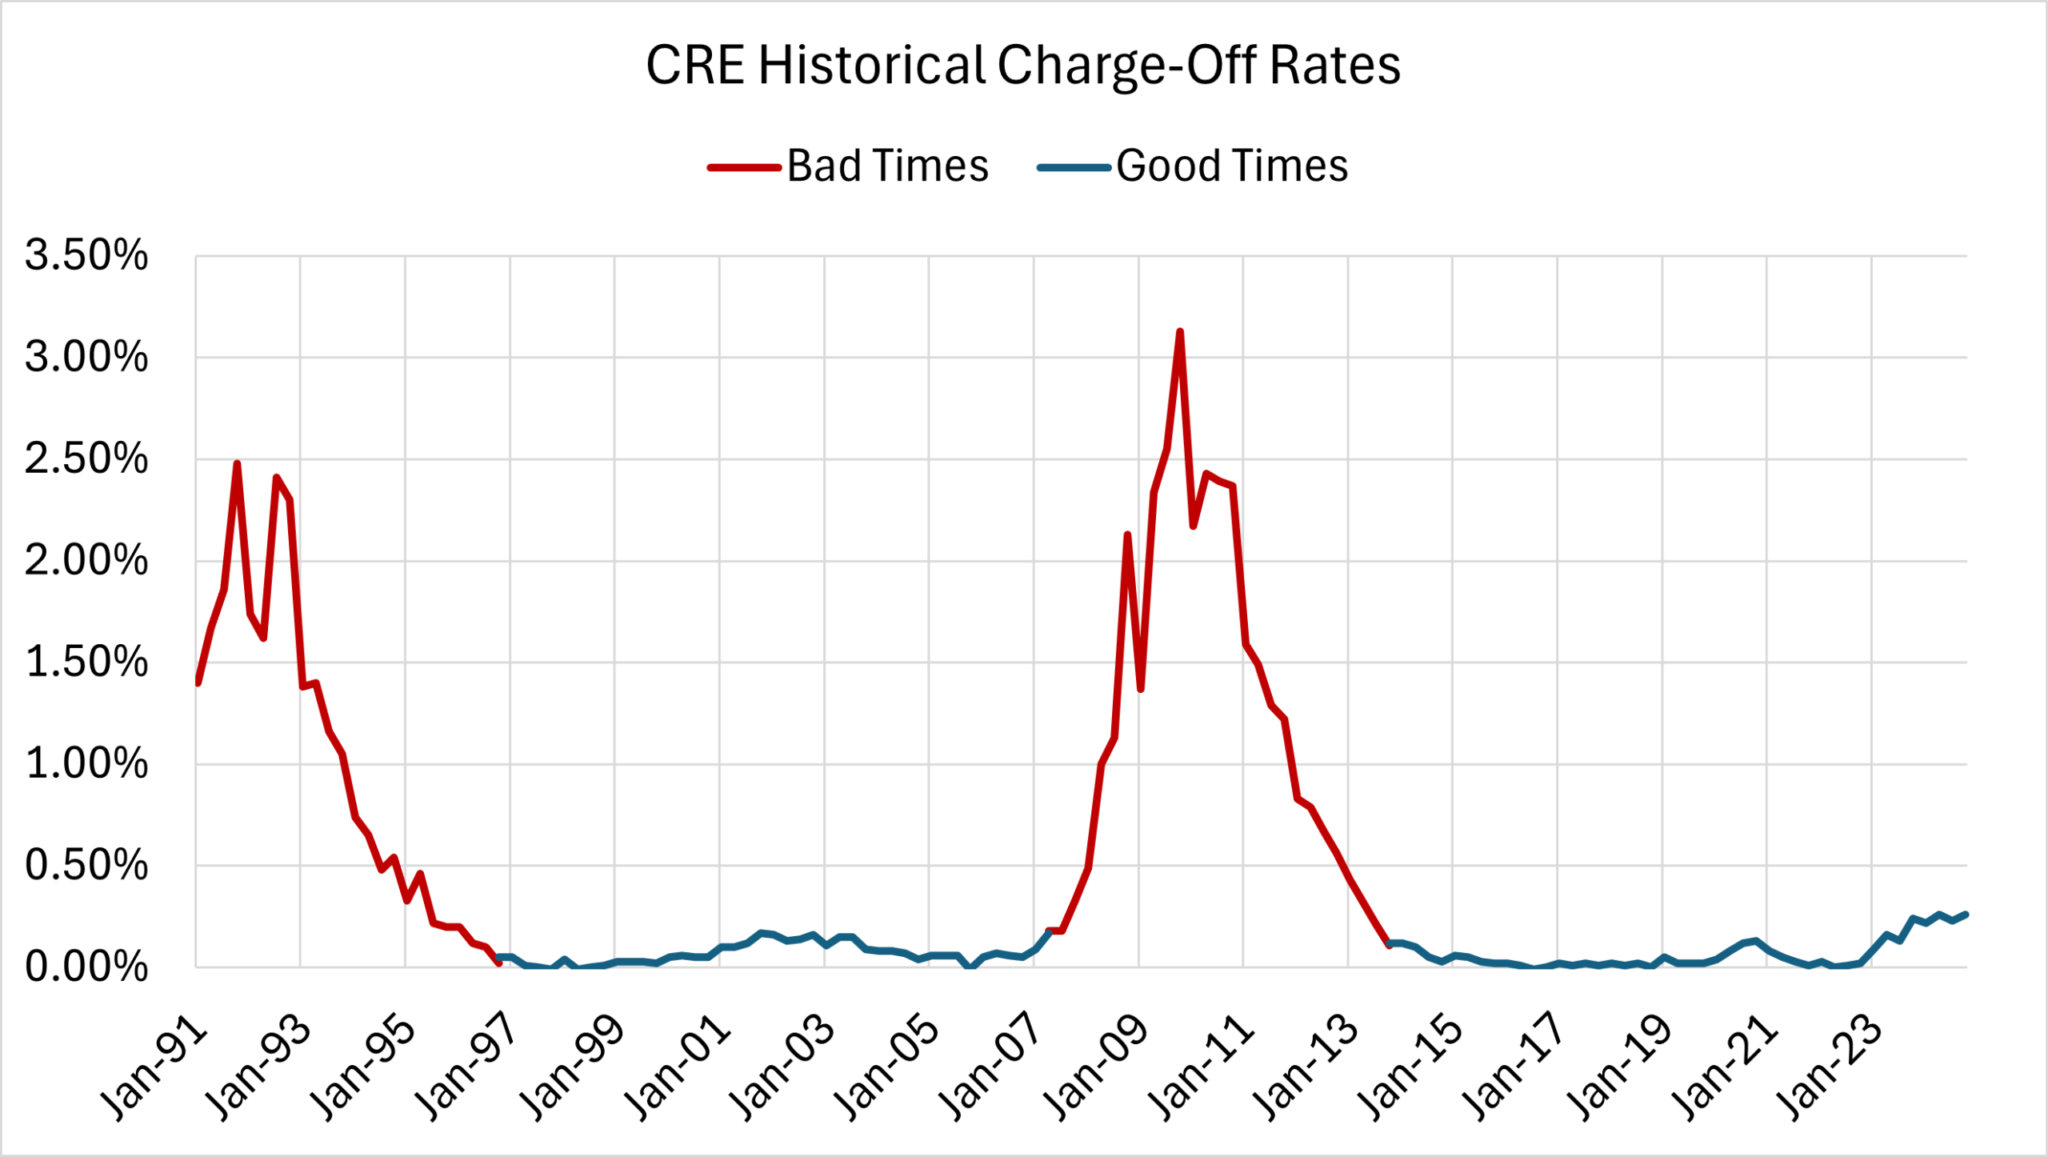
Charge-offs are practically zero—in the single basis points, in fact—in good times but soar to two orders of magnitude higher in bad times. When real-estate prices are stable or rising, defaulted properties can be sold for little-to-no loss. In bad times, when prices decline, nobody wants the “stuff” (because no one else wants the stuff).
For different loan types, loss rates during good time may be higher than CRE. Credit cards, for example, lose more in their good times than CRE loses in its crises. Nonetheless, regimes are present. That’s the source of systemic risk in credit markets.
Why might this be a problem? Well, because it’s human nature to be fooled by one’s own success. As everyone knows, success results from one’s own effort, and failure is just bad luck, right? But what if you haven’t faced a challenging environment? Then you’ve been extremely lucky and successful, not necessarily good.
4. A Short History of Good Times
After the crisis, all lenders benefited from a very favorable environment of historically low and stable rates and a tremendous infusion of liquidity by the Fed.5
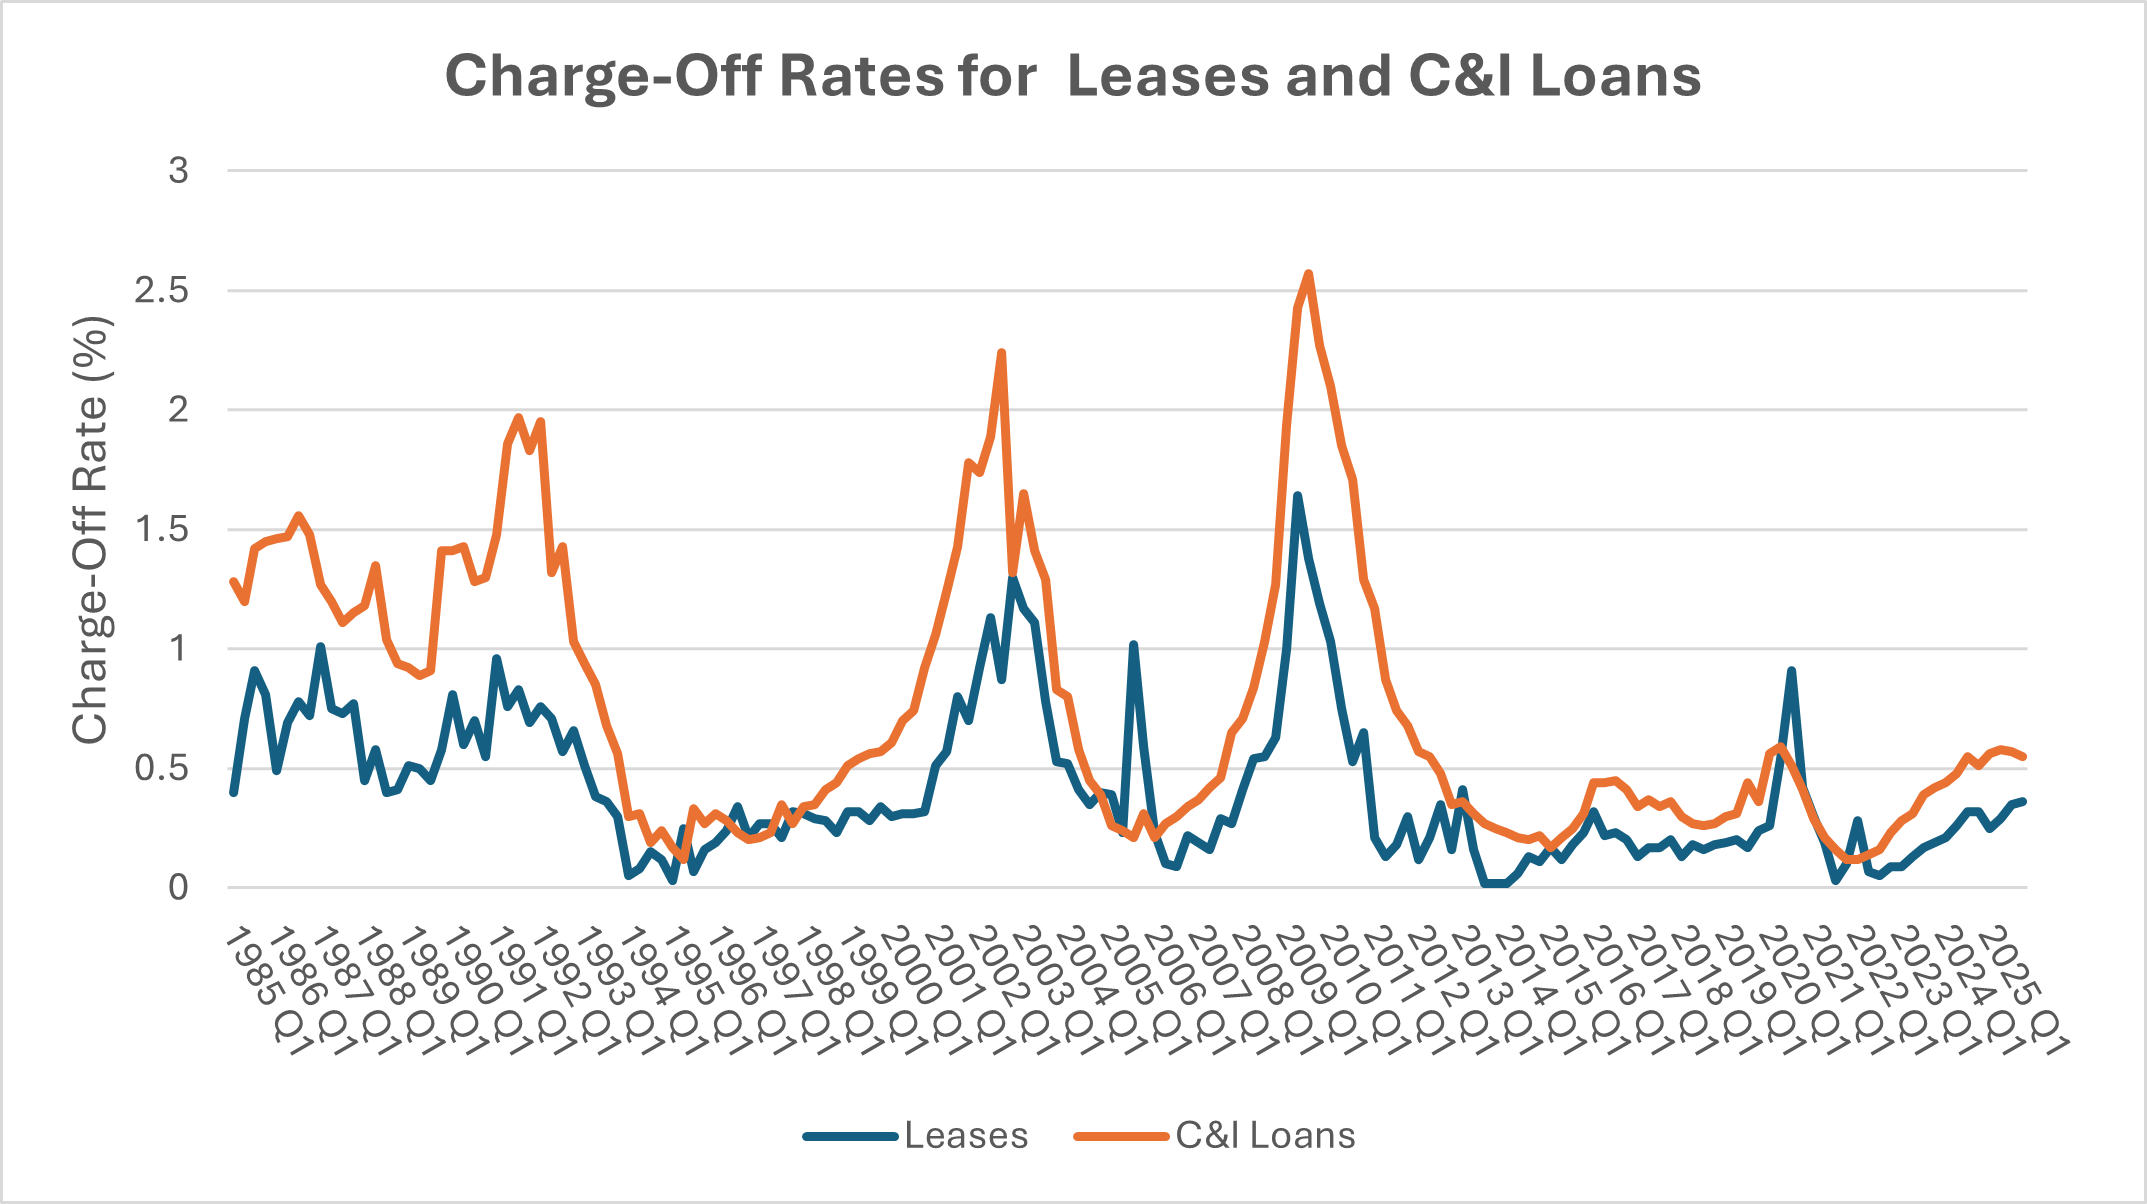
Since bank charge-off data is much easier to acquire than PC charge-off data, we use C&I charge-offs to illustrate our point. Ignoring the small spikes around covid, losses since 2013 have generally been under 50 basis points per quarter and have been that low for much longer than previous good times (in the mid-1990s and just prior to the crisis). By the way, the reason that you can ignore the covid spike is because it was immediately followed by a covid dip that was historically low and that cancels out the wee spike. It’s likely that the spike arose when regulators required quick reviews of all loans, and bankers became overly conservative and took large charge-offs that were quickly reversed; ergo, no real spike.
Recent good times coincide exactly with PC’s adolescence and maturity, if not its earlier (low-weight) birth in the oughts.
So, while it’s true that PC losses were very low during its growth spurt, bank losses were very low, too. Low interest rates made financing cheap. The Fed’s gigantic balance sheet made cash readily available, and together, asset values inflated making it hard, though not impossible, to experience credit losses. As with mortgage defaults amid rising home prices, if borrowers got into trouble, there was frequently a relatively painless exit for both debtor and creditor.
In fact, since the crisis there have been performance issues in only a handful of lending classes: certain CRE property types (offices), small bank credit card loans, and government student loans come to mind.6
Moreover, PC looks like a superstar if its performance over its entire history (since the early 2010s) is compared to banks’ performance over their entire available history (since 1985 at FRED), because PC didn’t exist much during the downturns of 1991, 2002, or 2008. There’s been nothing equivalent to the crisis in PC’s past to remind the industry of the potential pitfalls of owning highly leveraged loans in a downturn.6
Leveraged Loans and Good Times (before the Fall)
We’ve seen announcements and articles where PC firms have referenced their single-basis-point loss rates. Well, guess what? That’s not very different from bank and bond loss rates on similar loans prior to the crisis.
In August 2007, the trailing twelve-month U.S. leveraged loan default rate was 0.3%, after nine consecutive months in which no Moody’s-rated leveraged loan issuer defaulted. In fact, the overall speculative-grade issuer default rate dropped to 0.31% in 2007: the sixth consecutive annual decline and the lowest level since 1981.7
Moreover, the loss rate for Moody’s-rated corporate issuers fell to 0.15% in 2007, down from 0.27% in 2006. Bonds of all priorities in the capital structure enjoyed strong recovery rates compared to historical averages since 1982, with first lien loan recoveries running near the historical high of 87%.8
Alas, the good times ended—quickly and violently.
The U.S. leveraged loan default rate rose from 0.3% in December 2007 to 3.5% in December 2008 and peaked at 10.81% in November 2009, and the average recovery rate on North American first lien loans fell to 68%, compared with the historical average of 87% that actually includes crisis years—so the benign-period recovery rate was likely even higher, making the drop even steeper.910 (The senior unsecured bond recovery rate fell to 26.2% on a value-weighted basis in 2008, from 56.9% the prior year.11)
When combining the two components of loss—default rate and loss given default—the regime-based picture for first lien leveraged loans looks like this:
| Period | Default Rate | Loss Given Default | Implied Loss Rate |
|---|---|---|---|
| Good times (2006 −07) | ~0.3% | ~13% = (1 − 87%) | ~0.04% |
| GFC peak (2009) | ~11% | ~32% = (1 − 68%) | ~3.50% |
5. Accounting (or not) for Troubled Loans
As much as most bankers hate the oversight by examiners, regulators do keep banks honest and force them to recognize that certain loans aren’t likely to pay off. While extending-and-pretending via payment-in-kind (PIK) terms do exist in banks, the viability of such loans needs to be justified to an outsider’s (the examiner’s) degree of satisfaction; so, it’s less likely that serious deficiencies are ignored or that recognition of the problems is delayed.
PC doesn’t face the same level of scrutiny; therefore, it’s highly likely that there may be more pretending when extending. PC isn’t federally insured, and it can’t use the Fed as a lender of last resort; so, PC firms are free to internally classify loans however they want. It is their right, and no one should dispute that.
However, the problem is that by pretending, PC firms might be fooling themselves by systematically misremembering past events. If a default isn’t treated like a default (pretend it didn’t happen) or if the value destruction from delayed payment isn’t recognized (we’ll get it, eventually), then the historical record of defaults and losses is going to appear much more benign than it actually was. That’s a problem if the real but anecdotal history is forgotten when making new lending decisions; so, mischaracterization of the past can increase risk and lead to undesirable segment concentrations going forward.
6. Stress Testing and Scenario Analysis
Continuing on the accounting theme, it’s worth mentioning that for financial statement purposes, publicly owned PC funds must use CECL (Current Expected Credit Loss) to forecast expected losses, just like banks.
However, since PC isn’t regulated, it doesn’t face any supervisory expectations like the Fed’s SR 12-7, guidance on stress testing. For giant and largish banks, SR 12-7 is emphasized during both CCAR and horizontal capital reviews (HCRs), respectively.
We suspect that because PC is unregulated—not subject to the SR 12-7 guidance and the associated regulatory oversight—PC firms perform a lot less stress-testing than banks do, which—by the way—excepting the giants is generally less than what actually SR 12-7 suggests. (The implementation of the guidance is most evident during the annual capital planning exercises, and only at the largest bank do regulators seem to suggest that broadly and deeply applied throughout the organization. Still, the smaller banks have some stress-testing capabilities in place.) PC would do well to emulate any of these banks’ credit stress testing capabilities. PC should use the guidance as a starting place to identify and implement loss forecasting best practices. For lending institutions, SR 12-7 makes sense whether the entity is regulated or not. See this article for more on regimes and the possible value of bank regulation.
A few PC firms have recently stated that they will mark their loans frequently, including daily. From that we infer that if those firms perform any type stress testing it likely involves estimating loan value by adjusting or shocking credit spreads—in the denominators of their present value fractions—rather than getting a better understanding of the numerator (cash flows) in those fractions. While that approach has its uses, those don’t include answering, “What if” by estimating how much could be lost in a downturn. To answer that question, a PD-LGD-EAD loss forecasting framework the way to go.12
Bluntly, if PC doesn’t stress-test its portfolios in the same way that banks do, that could be a huge mistake—especially with respect to investigating the effects of downturns. For example, by performing historical scenario analyses like asking, “What if we had a repeat of the economic conditions from 2007 − 2012, how much could we lose?” That exercise requires data; an understanding of how economic conditions influence borrowers and loan risk factors (in a mathematically rigorous way); parameter (economic) forecasts; and a platform to aggregate forecasted results and perform sensitivity analyses. (See our post on mortgage loss forecasting in Fort Myers MSA as an example.)
Consider Graph 2, above. Peak C&I losses correspond to recessions and other unnatural disasters, like the dotcom crash, i.e., systemic or economy-wide events. If a lender isn’t stress-testing its portfolio with respect to economic conditions, there’s a good chance it hasn’t identified which environmental factors can cause harm to its debtors—and therefore to itself.
Answers to those “What if” questions are just the start of risk management. It isn’t just about determining how much could be lost, but how and why it could be lost, and then:
- Taking preventive actions to avoid those losses, e.g., limit exposure to certain industries;
- When possible, buying insurance before the event happens; or
- Planning and implementing contingencies if such bad scenarios were to arise.
Without macroeconomic-based stress testing, systemic risks are likely ignored, especially if they’ve never been experienced by relatively young institutions that grew in good times.13 See Credit Regimes, Risk Management and the Value Stress Testing.
For PC today, it’s probably too late for (1) and might be too late for (2). However, quickly implementing a rigorous bank-like stress testing program could help with (3), especially since crises take time to run their courses and contingencies can be planned and executed when necessary. Fortunately, we know just the experts who can help.
Conclusion
Let’s summarize the main points.
- After the crisis, PC’s initial growth spurt involved replacing banks as lenders to risky, highly-leveraged borrowers.
- It’s well known in the academic finance literature that the possibility of bank runs disciplines bank lending. That consideration is absent for PC. So, beyond the initial emphasis on risky loans, PC has an ongoing incentive to make more of risky loans.
- In good times, almost no one loses money; it takes special “skill,” like small bank credit card programs or the government making student loans, to do the trick. From the early teens until recently—pretty much PC’s entire history—we’ve had good times: low rates and tons of liquidity.
- Not losing money on risky borrowers that caused large losses to banks only a few years earlier could give a new lender a false sense of security and superiority. Indeed, PC has riskier portfolios, but its lifetime loss rates are low when compared to banks’ lifetime loss rates. The problem is that banks have lived a lot longer. In some ways, banks are like old people who have experienced life’s challenges and ups and downs. PC is like a teenager that hasn’t. (Like all the old guys who were in WWII and Korea and laughed at us when we were convinced of our own invincibility.)
- Not recognizing problems by extending-and-pretending might be a viable strategy, but without proper recordkeeping it could provide a false sense of security and satisfaction, leading to inefficient prospective lending decisions. (“There but by the grace of God go I.”)
Marginal borrowers don’t perform marginally worse than creditworthy borrowers in a downturn. Marginal borrowers perform substantially worse. With regimes, that’s pretty much the definition of both safe and risky borrowers. Safe customers aren’t at the mercy of their environment. Risky customers are.
We don’t know the future, but it seems reasonable to conclude that if a downturn were to occur, PC losses would be substantially worse than bank losses in similar portfolios and industries.8
Since no one knows the future, planning for different scenarios seems to be a reasonable and cost-effective way to manage risks. For lenders, that means determining how and why losses could arise—i.e., stress-testing—the first part of strategic risk management. It would be utterly irresponsible of us to not mention that we can help.
One final note: as we said we anticipate that if a downturn were to occur, PC would lose more than banks—but that comes with one qualification: the inequality is only likely to hold for banks that haven’t lent heavily to PC. (Oops! More on this when we release our finance research paper.)
- That being said, what’s the over/under for the remaining life of consumer tax prep software?
- NBFIs in Focus: The Basics of Private Credit, Federal Reserve Bank of New York.
- Ibid.
- We’re currently writing a theoretical research paper that proves this result—albeit in a highly-structured, mathematical setting.
- Look at the size of the Fed’s balance sheet: fred.stlouisfed.org/series/WALCL, or industry-wide bank mortgage charge-offs since 2018, which have been negative almost every quarter.
- See fred.stlouisfed.org/series/CORCCOBN, for example. PC was a tiny asset class during the 2008 crisis.
- Emery, Kenneth, et al. “Syndicated Bank Loans: 2007 Default Review and 2008 Outlook.” Moody’s Global Corporate Finance, January 2008. moodys.com.
- Emery, Kenneth, Sharon Ou, et al. “Corporate Default and Recovery Rates, 1920 − 2008.” Moody’s Global Credit Policy Special Comment, February 2009. moodys.com. See also: Bloomberg, February 2026.
- “US leveraged loan default rates move higher after two-dozen defaults in 2023.” PitchBook LCD, January 4, 2024, via Yahoo Finance.
- Emery, Kenneth, et al. “Syndicated Bank Loans: 2008 Default Review and 2009 Outlook.” Moody’s Credit Policy Special Comment, March 7, 2009. moodys.com.
- Ibid. (See Exhibit 5, value-weighted senior unsecured bond recovery rates.)
- PD-LGD-EAD framework involves estimating future default rates (Probabilities of Default, or PD); Losses Given Default (LGD); and future balances also known as Exposure at Default (EAD).
- That’s similar to the cause of Silicon Valley Bank’s demise, but with a different type of risk. SVB grew rapidly during a time of relatively stable interest rates and didn’t have the historical perspective of structural interest rate risk—in that case, how quickly it could go bad when rates increased.