While they last, it’s easy to forget that good times will end, but it’s inevitable. For lending, bad times arrive in a deluge of defaults and losses. For example, roughly 80% of mortgage losses occur in spurts in about 20% of available history that contain the flood of defaults. Not remembering that you’re in a race against the bulk of losses can be very, very costly. In this article, we describe credit regimes and explain how the big risk builds during calm periods, how it can be contained, and hint at a new service that measures and helps manage it.
Updated October 2026: figures revised, message unchanged; see Notes & Sources.
Good Times, Bad Times
What do we mean by a “regime?”
We mean a period of time where outcomes are consistent—either consistently good or bad. For example, they occur in an environment, market, or industry where periods of calm—sometimes long periods of calm—are interrupted by seemingly sudden and intense turbulence and loss; we’ll call that sudden change a “deluge,” and since we’re focused on credit, we’ll refer to one as a “credit deluge.” With regimes, loss rates are bimodal, like bank industry-wide Commercial Real Estate (CRE) net charge-offs shown below. The average loss rate across all time doesn’t represent any particular time; it’s a number between a very low rate and a very high one. For example, our average, good-time, net charge-off rate is 6 bps versus a historical average of 46 bps and a bad-time average over 1%.1 If you want a natural analog, it’s like a river that’s dry or low most of the year but occasionally floods. The average—seasonally adjusted—depth is only measured when the water is rising or falling; so, knowing the average isn’t very useful for planning purposes, because knowing it doesn’t help determine whether you should walk or swim across it.
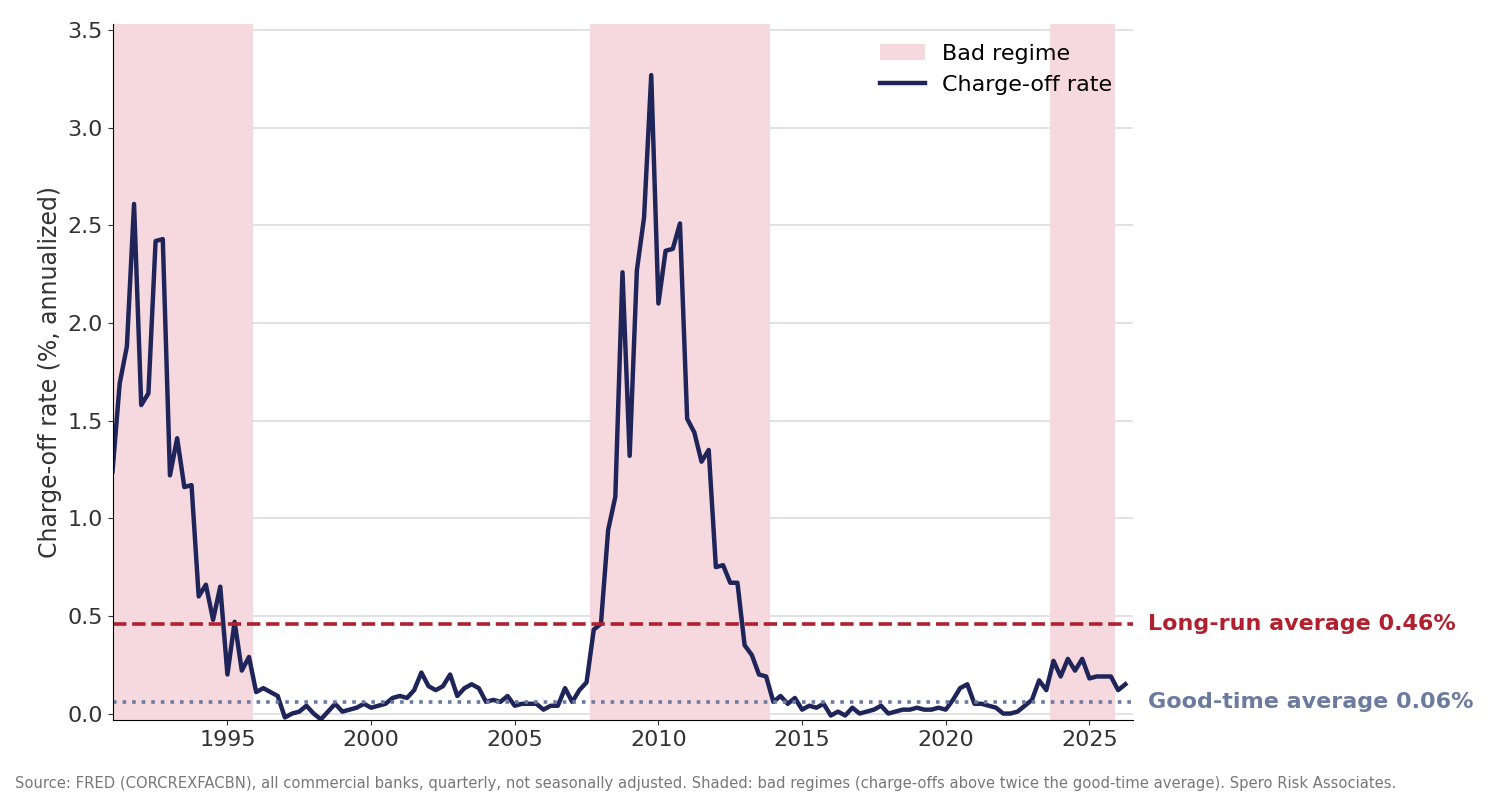
Commercial real estate charge-off rate, all commercial banks (FRED: CORCREXFACBN), with its long-run and good-time averages. Shaded areas are bad regimes based on our simply >2x good-time average rule. Let’s see how bad the recent shaded area becomes if extend-and-pretend fails as rates rise.
As we show below, the same loss pattern occurs with residential mortgages, too. In good times your portfolio can absorb defaults and the subsequent low losses associated with idiosyncratic borrower or loan problems. That’s what makes them good times, after all! That doesn’t mean that there is no work to do across your loan portfolios, but excluding fraud, you won’t lose much, because either (1) your collateral’s value is likely to have remained high—think rising house prices—or (2) for, say, an unsecured business loan, someone else may want to give the business a try or at least buy the assets to use elsewhere.2 In bad times, neither condition tends to hold… and you’re stuck with stuff that nobody wants at exactly the worst time.
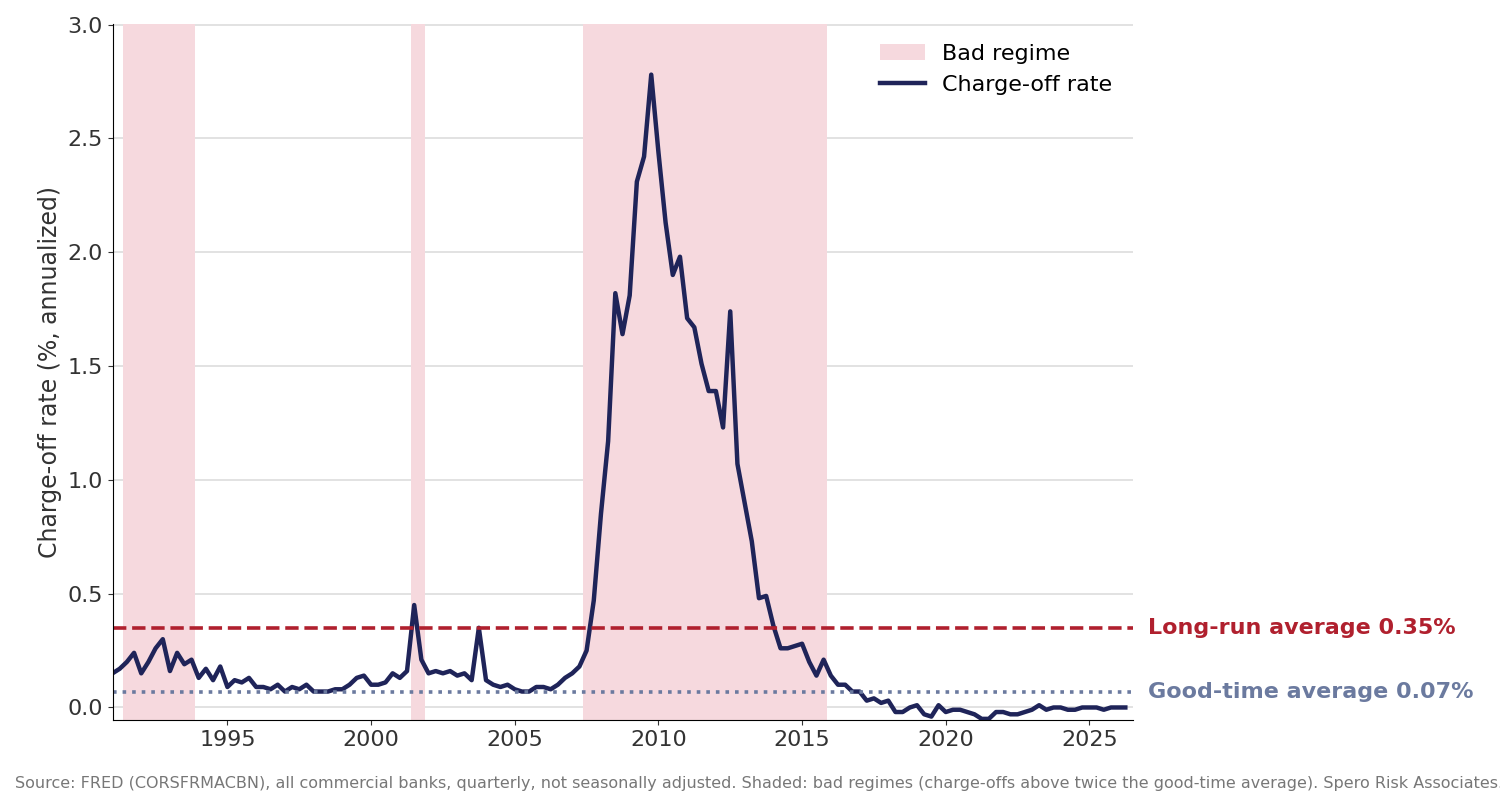
Residential mortgage charge-off rate, all commercial banks (FRED: CORSFRMACBN), with its long-run and good-time averages. Shaded areas are bad regimes.
Running the Wrong Race
Credit modelers—implicitly or explicitly—often use a competing hazards approach for loss forecasting. What’s that? That’s just a fancy way of saying there is a race between pay-off (usually good) and default (bad, but in good times, usually not too bad). Some modelers spend a lot of time and effort on getting the two rates right across borrowers, times, and (some) conditions. It’s useful work, but it’s not the race that really matters, because, as the graphs show and as we’ve mentioned, the preponderance of losses occurs in bad times: for residential mortgages, ~80% of cumulative losses occur in ~20% of the quarters, and those quarters cluster together. Take a minute to consider that: ~80% of cumulative losses occur in ~20% of the history. (When you see such numbers, here, note that for comparability, we’re holding balances constant through time, which seems like the right thing to do.) The problem with focusing on the race within the race during good times—where 80% of the observations lie—is that it can obscure the race with bigger consequences. That’s the 80% of history that doesn’t tell you much.
For most portfolios you can substitute a good-time loss rate, like our 6 bps above—or a set of good-time loss rates conditioned on borrower and loan characteristics—for a model and lose very, very little. In fact, if you have a strategic perspective, you’ll realize that you’re usually losing nothing—literally AND figuratively. Look at the graphs above; the averages in good times would suffice as a quarterly loss estimate… in good times. Averaging that good-time rate with the bad-time rate tells you very little, and that can be a big problem for stress testing, where developers always want more observations for their statistical tests but not necessarily the right observations (to understand how and when most of the losses arise). Reverse our numbers above: ~20% of resi’s losses occur in ~80% of the history. And a statistical fit counts observations, not losses. If you pool the regimes, the good times get ~80% of the weight in the estimates—and in the tests of the relationships—while producing only ~20% of the losses. More good-time observations aren’t going to help estimate the losses you (should) care about.
Resources are limited. Spending money on re-estimating models to change the good-time estimate (by a basis point of a basis point when your good-time losses are, at most, basis points) means you’re not spending it on identifying the conditions that could accelerate the arrival of bad times or make their consequences (full percentage points, not basis points) worse.
How Low Good-Time Losses Lead to High Bad-Time Losses
Regimes—whether credit, interest rate, or whatev—are everywhere, all the time. Ecclesiastes (3:1) knew it, as did those who lived along the Nile and the Euphrates thousands of years ago. Nile floods were so predictable that Egyptians based their calendars on their arrival. Credit deluges are more like floods on the Euphrates; the intervals aren’t as certain. What is certain is that the floods will occur, and they’ll be costly.
What is inescapable is that a period of 20 or even 50 years of dry evidence doesn’t preclude the possibility of, or damage from, a 100-year flood.3
Likewise, a period of 15 years of low loan losses doesn’t preclude a credit deluge and bad times. Those bad times tend to generate losses that are nearly two orders of magnitude (>50x) greater than the minuscule loss rates observed in good times. As we mentioned above, total losses during shorter, bad times are multiples of total losses during longer, good times. For example, CRE losses in bad times are 6–11 times those of good times. That’s despite the fact that good times last 2.0–2.7 times as long.4
The reader might argue that our use of “doesn’t preclude,” above, is very different than “will cause.” Of course that’s true. What we do know is that deluges are not just possible, they’re inevitable, and they’re more likely to arrive sooner and hit harder under certain conditions, including:
- Believing that we—our glorious generations—are at the end of history. Yeah, it may be different this time, but not that different. We have not eliminated risk. It’s not even clear if we understand it better. Maybe we hide it better or unintentionally obfuscate it and then take comfort in not seeing it.
- Not knowing that you’re in a good regime, or knowing but exempting yourself from history and the inevitability of a regime change, alters your behavior and decisions. If good times are the new normal, then loosening standards can look smart. To see that, consider what the decision becomes. Let’s set funding costs to zero so we can ignore them. In that case, in good times, looser credit standards generate marginal expected interest revenue that exceeds (short-term) marginal expected credit losses; so, short-term profits may increase. Using that as evidence that lending lower down the borrower quality scale is safe is like standing in a dry river bed, noting that it seems to never rain here, and then deciding to build your house lower on the bank. Why not? The land is cheap, too!
In good times, you may not notice that marginal borrowers have less margin, less cushion, like the private credit borrowers or ARM holders who can’t withstand an interest rate shock. In calm, good times, looser standards raise the probability of default only slightly, and as we noted above, when a loan does default, you can usually offload it with little loss. Look at those graphs: net charge-offs are negative a decent amount of time within the good regimes.
The question is what happens in the long term, where “long term” includes a deluge with an uncertain start date, followed by bad times of uncertain severity? That is the real race:
Will you get paid back before the deluge hits the fan?
For the moment—and only for the moment—ignore the fact that if lenders loosen lending standards during a period of prolonged calm, those actions will likely accelerate the arrival of bad times, increase their severity, and maybe their length. Even without those compounding factors, you’ll lose quite a bit more in bad times because marginal borrowers and projects don’t have the wherewithal to survive hard times. That’s the direct effect, and no different than building far down on the river bank because it’s been dry for so long.
The indirect, but predictable, effect is the major difference between our river analog and lending. Lending to one marginal borrower might not matter much, but if you do it, and everyone else does it, and your marginal borrowers transact amongst themselves or with your peers’ marginal borrowers, then a small ripple of inconvenience near a few can become a tsunami of despair. That’s what you learned in integral calculus: a bunch of nothings can add up to something.
Unfortunately, even otherwise sound borrowers can become marginal during good times:
- If they have an expanded or large customer base of marginal—and now failed—firms, the old stalwarts become riskier.
- Under certain conditions, like low interest rates and ample liquidity, highly rated credits may be tempted to invest in marginal projects they’d never have considered if money were scarcer… thereby making themselves less creditworthy—even though their track records to that point said otherwise.
Commercial & Industrial loans behave similarly to resi and CRE, but with somewhat higher and more variable levels of losses in good times.
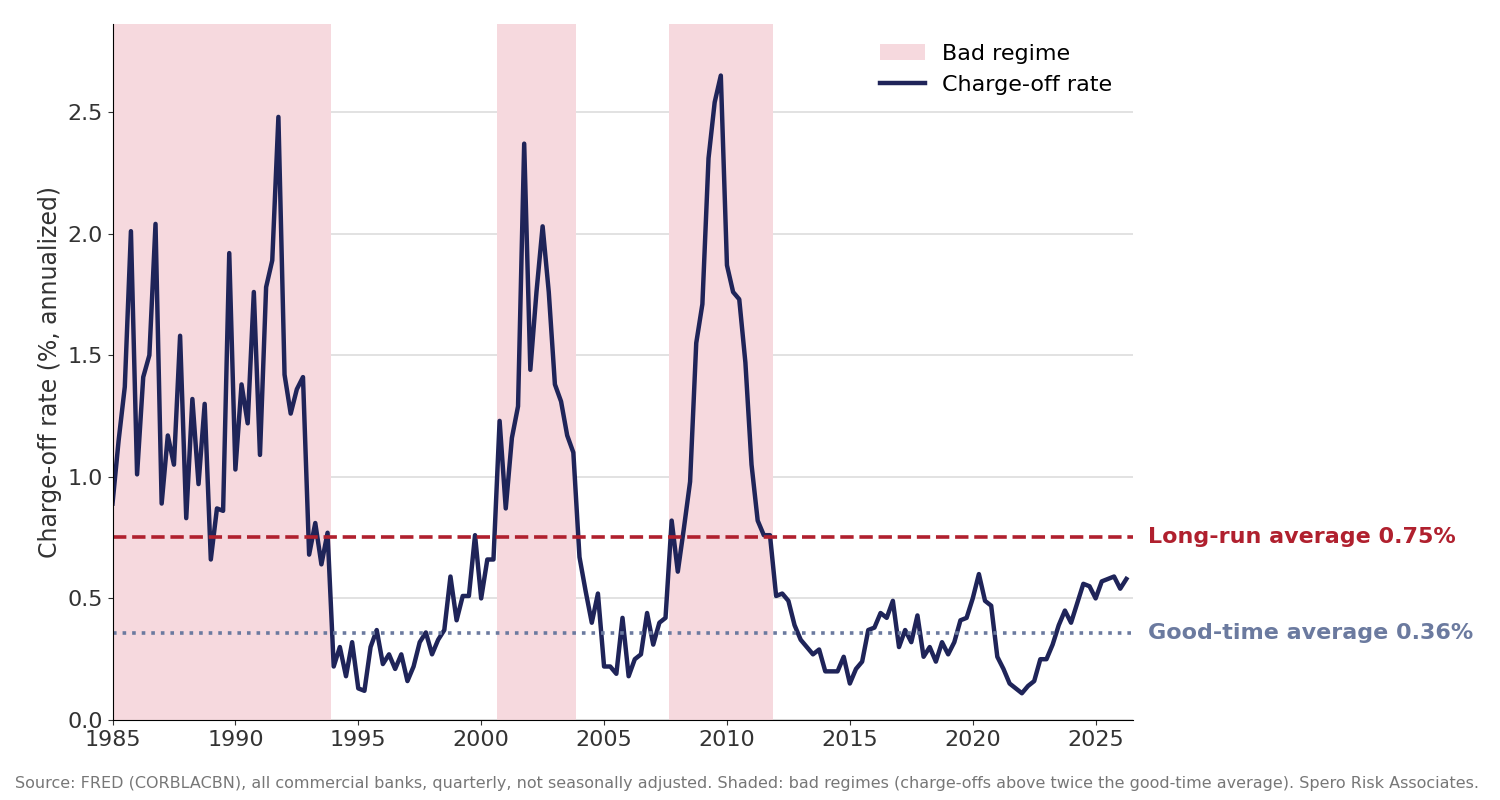
Commercial and industrial loan charge-off rate, all commercial banks (FRED: CORBLACBN), with its long-run and good-time averages. Shaded areas are bad regimes.
What we’re describing (for at least these three portfolios) is known as the “cascade” effect and “percolation.” The cascades aren’t accidents. They’re collisions with foreseen consequences. So, congratulations! Marginal-loan-by-marginal-loan, the industry has created systematic risk, which becomes severe enough to become systemic risk, during good times.
That’s how lending differs from our river metaphor: building lower doesn’t increase the chance of flooding rain. Lending lower does.
So how does anyone talk themselves into believing that there are only good times or it’s different this time and the past is irrelevant? Let’s ask the Oracle at Delphi.
Private Credit: Our portfolio is pristine. Isn’t it? Loss rates are in the single basis points. We can’t lose, can we?
The Oracle: Your leveraged loans are the same as the banks’ in 2006, when they had single-basis-point losses. A few years later, they lost 80–90 times that rate.
Private Credit: No, it’s different this time. We’re not banks.
The Oracle: Oh, okay!
(To herself: Let’s see how that works out for you.)
Our readers wouldn’t be fooled so easily. They would want to know, “What can be done in good times to mitigate the harmful effects of bad times?”
What Should You Do?
If you go through these six steps before the next downturn, you’ll be able to avoid much of loss and subsequent grief that your peers will face. You won’t have to work through Kübler-Ross’s five stages to process what happened to you when the wave hit. The inevitable happened. You’ll also be ready to capitalize on the deluge, when prices are low and with capital to deploy, rather than be another victim.
1. Denial: good times won’t last forever.
Suffer neither myopia nor tunnel vision. Realize that your actions and decisions—however small—have their own long-term effects, and they can combine with others’ actions to hasten the arrival and increase the severity of a deluge. Recognize that your long-term planning horizon must include a deluge.
2. Anger: don’t blame others; learn from them.
Times do change, e.g., unprecedented low rates and liquidity, but not that much; there are always marginal borrowers who can do real harm to themselves, others, and you. Don’t look for reasons why the past is irrelevant. Look for reasons why it’s relevant. Don’t throw out the lessons of the past because there isn’t enough data from the time to build a model. You take hundreds of actions a day to prevent harm to yourself. You don’t need a model to fasten your seatbelt. For a short list of repeat failures that might not have been identified as such at the time, see the appendix.
3. Bargaining: ask “what if?” and measure the answer.
That involves more stress testing than most banks currently perform.
For larger organizations, CCAR may be a necessary regulatory exercise, but it’s not sufficient. CCAR is nine quarters. Starting in 2007 and depending upon how you measure the regimes, the bad times lasted for 6.5–8.5 years, 5.0–6.3 years, and about 4.3 years for resi, CRE, and C&I, respectively. The minimum of those regimes was 17 quarters, nearly twice CCAR’s nine quarters. If the window started perfectly at the GFC’s onset, then CCAR’s nine quarters would only capture 32–40%, 44–51%, and 58% of its charge-offs for resi, CRE, and C&I, respectively.5
For those three portfolios, here’s a look at major downturns since their series, available at FRED, began. Note CCAR’s nine quarters only capture mild cases. That’s not “severely adverse,” by any definition.
| Portfolio | Bad regime | Length | Losses inside the first nine quarters |
|---|---|---|---|
| Residential | 1991–1993 | 2.5 yrs | 90% |
| Residential | 2007–2015 | 8.5 yrs | 32% |
| CRE | 1991–1995* | 5.0 yrs | 70% |
| CRE | 2007–2013 | 6.3 yrs | 44% |
| CRE | 2023–† | Extend-and-pretend. Let’s see what happens. | |
| C&I | 1985–1993* | 9.0 yrs | 27% |
| C&I | 2000–2003 | 3.3 yrs | 74% |
| C&I | 2007–2011 | 4.3 yrs | 58% |
We define a bad regime as a stretch when charge-offs run above twice their good-time average; the series are not seasonally adjusted. There is nothing special about that definition. *The CRE series begins in 1991, and the C&I series in 1985, in the middle of these episodes, so they were longer than shown. †Charge-offs fell below the threshold in 2026 but remain about twice their good-time average, while CMBS special servicing reached its highest level since 2013. That is consistent with deferred losses, not resolved ones, so we exclude this episode from our calculations. Even a window placed perfectly over the peak would capture only about 48%, 63%, and 73% of the GFC’s resi, CRE, and C&I losses.
So, one concrete action is to set your forecast horizon for each portfolio equal to the average length of its stress periods. If you want to be conservative, choose the maximum length (observed in the GFC for real estate, and in the early 1990s for C&I). That’s a marginal improvement, not a fundamental one.
4. Depression: understand depressions. Use loan-level stress tests differently.
An expanded stress test is better but not great. The solution does involve loan-level stress testing… but used creative, clear, and faithful ways to identify the long-term implications that through-the-cycle averages and other risk management metrics ignore, hide, or obfuscate.
- CECL reserving doesn’t capture it.
- Typical stress testing doesn’t capture it.
- Vintage/TOB analysis doesn’t capture it.
- Economic Capital doesn’t capture it. Trying to find a one-in-a-thousand-year loss with 20 years of data—think dry river bed—doesn’t capture anything except The Politician’s Fallacy.
- Traditional portfolio management methods don’t capture it.
- Model validation and back-testing in good times—where even a fixed, conditional average tests well—don’t capture it.
- Risk ratings and credit scores, either point-in-time or averaged through-the-cycle, don’t capture it.
- RAROC and pricing to one-year expected loss don’t capture it.
- ALM and credit, run separately, don’t capture it. That’s how private credit borrowers could default in the fourth year of a loan, after their three-year rate caps expired. A change in the environment that no one considered.
Each function, each metric does something; it provides a facet—a narrow, assumption-laden perspective. Individually and collectively, they’re insufficient to identify the risk that kills—the wave. If you know the old analogy of the blind men and the elephant, then each method touches a real part of the elephant. None of them sees the elephant. Failing at nothing. Failing at everything by not managing the one risk that matters the most.
So, what do we have? First, note that it’s impossible to manage any portfolio without knowing how, where, when, who, and why you could lose money. Without those facts, there’s no way to tell which positions to add and which to cut. We’ve shown that across the three portfolios, most (~80%) historical losses arrive in the deluge; so, your risk management should be built around the deluge. Day-to-day tasks are necessary, too, but they’re probably built around good times and the (smaller) risks seen there. Managing risk in the next quarter is easy; it’s too late to do anything. So, action becomes reporting, reports emphasize the short term, and that becomes a cycle. You should be managing for the next deluge, not the next month-end or quarter-end.
5. Acceptance: the loss is coming. Measure it now.
All of this can be done with the loan-level data you may already have. Why loan-level? It’s the only way to identify your truly marginal loans: the 20% of borrowers who will generate 80% of your losses in bad times… which are 80% of your historic losses. A fifth of your loans, in a fifth of the time, produce nearly two-thirds of everything you’ll ever lose. That seems like something to think about!
The rest is standard risk management: (1) identify, (2) measure, and (3) act today or plan now on how to act when the deluge arrives.
That doesn’t require knowing when the deluge will come. It only requires admitting that it will.
A trade-off to consider: tightening (or not loosening) standards in good times costs you something visible every good quarter: the spread on the marginal loans you don’t make. What it buys is substantially less tail risk when the deluge arrives, and there are specific, precise methods to measure that risk. In a crisis, your losses will be substantially lower—not the two-orders-of-magnitude increase that some others will see—and you’ll have the capacity to lend and buy when others can’t. It reminds us of Kipling’s “If—”: If you can keep your head when all about you / Are losing theirs and blaming it on you… If you can meet with Triumph and Disaster / And treat those two impostors just the same… If you can wait and not be tired by waiting…
The goal isn’t the best return only in good times. It’s the best return over time, including when the deluge is counted. So, either you can count it, or it will count you… among its victims. You can measure the costs and benefits of discipline and make the case to your board and investors in advance. Agreed upon beforehand, the opportunity cost, which may appear to the uninformed as good-time “underperformance,” is just an insurance premium. Measured that way, the lender who tightens (or doesn’t loosen) doesn’t underperform; the others just hadn’t incurred the cost yet.
6. Contact us.
If it’s not already clear, yes, we know what to do, and how to do it in the most cost-effective way. To learn more, contact us.
Appendix: That Was a ‘Them’ Problem, Not an ‘Us’ Problem
Maybe, but probably not.
We’re planning a long article on the repetitive nature of regimes across the years, decades, and centuries, but here is a short list.
The S&Ls weren’t the thrifts that got destroyed in the rate shock, and they were right about that. The old model—thirty-year fixed mortgages funded with passbook savings—really had been killed by Paul Volcker’s rate shocks, and everybody knew it. Deregulation handed them commercial real estate, junk bonds, direct equity stakes, and brokered deposits to fund it all. They called it diversification. They should have called it a minefield. What they had actually done was trade a rate-risk problem for a credit-risk problem… in asset classes they had never underwritten… with a regulator that had never overseen any of it.
1998 wasn’t a mania. It was convergence arbitrage, run by people who had won the Nobel Prize for the math. The positions were hedged: go long the cheap instrument, go short the rich one, and collect when the spread closed. That’s what justified the leverage; thirty times isn’t a big deal if you’re not taking a directional bet, right? Then Russia defaulted, every spread widened at once, and it turned out the long and the short legs were the same trade. The “hedge” was actually a correlation assumption dressed like a hedge.
Telecom in 2001 wasn’t the dot-coms, and the distinction was real. Dot-coms were websites with no revenue; this was conduit, switches, and transoceanic cable—built by companies with actual contracts, financed with actual high-yield debt. Everyone cited the statistic that internet traffic was doubling every hundred days, but… nobody checked it, and… it wasn’t true. So, capacity became several multiples of demand, and it turned out that fiber in the ground is worth roughly nothing if there’s no traffic to put on it. (Reminds us of the old 19th-century plank roads. Also reminds us of something else. What could that be?)
Subprime wasn’t the S&Ls, because the risk didn’t stay in one place. The broker got paid at the closing table, the aggregator got paid at the sale, the trust got paid at issuance, and the tranches went to somebody who would never meet the borrower. Everybody in that chain was underwriting the next transfer, not the loan itself. Let’s drop the notion that this was a fraud committed by borrowers. If you write it, they will come; stated-income lending was a product category, pushed because loans closed faster and were priced better, and the 2/28 with a teaser reset was underwritten to a future refinancing rather than to payment. (Pro tip: not a good idea.) The loan was designed to be replaced before it became a problem. That works fine as long as somebody is there to replace it or buy the house.
Private credit isn’t leveraged-loan banking in 2006. It’s senior secured, sponsor-backed, with covenant, held to maturity by “patient capital” that doesn’t have to sell in a brief downturn. The floating coupon is described as protection against rising rates, which it is—for the lender—but not for the borrower, especially the marginal borrower who doesn’t buy (or can’t afford) interest rate protection and can’t absorb a rate increase. It’s just a coincidence that bank loss rates pre-Crisis are similar to PC loss rates pre-current situation, right? PC’s low loss rates have nothing to do with extending-and-pretending, which reduces defaults on, otherwise severely delinquent loans, do they? (BTW, does PC even have collections departments? Won’t that affect LGDs?)
Credit insurance and CDS (credit default swaps) weren’t the mortgage guarantee companies of the 1920s and early ’30s. Those offered a 5% coupon guaranteed by a large title or insurance company. There were no models, just the guarantor’s word. The 2006 versions had models! And AAA ratings! And AIG insured only super-senior tranches! (The ones that couldn’t be reached according to the models that didn’t represent reality.) The 1920s guarantors pooled mortgages they had guaranteed, put them in trusts, and sold shares in the pools to ordinary investors. They were pass-throughs with a guarantees, eighty years early. The business kept growing into 1930, on a decade in which rising prices had let defaulted properties be sold without a loss. (Defaults without losses. Does that sound familiar?) But prices fell about 25% between 1928 and 1933, and in August 1933, the State of New York seized fourteen companies in one month. By the end of the year, nobody was guaranteeing mortgages. The answer, in 1934, was the FHA. That brings us to our next depressing entry…
FHA isn’t subprime: every loan is full-doc, every income verified, every borrower underwritten. No liar loans! That’s all true, and it’s also all beside the point. About 7.05% of FHA mortgages issued in 2024 went seriously delinquent within twelve months, compared with 7.02% for FHA’s own loans at the 2008 peak.6 So recent FHA loans perform as poorly as FHA loans did near the peak of the Crisis, and we’re not in a crisis. The better comparison, though, is with subprime loans before the Crisis. The best we can tell, and shockingly, subprime vintages from 2003–2006 performed better in their first 12 months—sometimes much better—than recent FHA loans have. That changed in 2007, when they performed worse, but that was the start of the Crisis.7 So: worse performance, but with honest paperwork. It’s the same people who couldn’t afford the house—just a generation removed. Loan-to-value (LTV) determines the severity, not the quality of the borrowers’ documents (even if they’re notarized!), and 3.5% down is 3.5% down. Turns out that 3.5% down isn’t very much. The documentation problem was fixed. To what end? (Oh well, it’s only the taxpayers’ money! More precisely, their great-grandchildren’s.) Oh well, those houses are concentrated in other neighborhoods—who cares about the collateral damage of those exploding loans? Home prices will recover, right? More on that soon.
Crypto is new! It’s not like tulips! Nothing it before! It’s spent electricity! It’s new in the sense that you can’t grow it and enjoy it for a week or so, like a tulip. Otherwise, you’re betting that someone will want it at greater than what you paid for it, while it returns nothing to you and generates no cashflows of its own.
The Tulip Bulb mania of 1637 seems silly to us sophisticated, modern types because it was so obviously silly: everyone knows what a tulip is. Our examples since the 1970s are the same errors, just better hidden, because we’re all very sophisticated nowadays. Who could have known?
Subprime and FHA early defaults (footnote 7). Share of loans in default 12 months after origination. Subprime: Mayer, Pence, and Sherlund, “The Rise in Mortgage Defaults,” Federal Reserve FEDS 2008-59, Figure 2 (figure data). FHA 2024: Allysia Finley, Wall Street Journal, February 23, 2025 (90+ days seriously delinquent within twelve months; comparison approximate).
| Vintage | In default 12 months after origination |
|---|---|
| Subprime 2004 | 1.7% |
| Subprime 2005 | 2.8% |
| Subprime 2006 | 5.8% |
| Subprime 2007 | 9.3% |
| FHA 2024 | 7.05% |
Sources: Charge-off series from FRED: CORSFRMACBN (residential), CORCREXFACBN (CRE ex-farmland), CORBLACBN (C&I), not seasonally adjusted. Regimes, lengths, shares of losses, and nine-quarter capture rates are Spero Risk calculations, using two definitions of a bad regime (charge-offs above their long-run average, and above twice their good-time average). Peak-to-calm ratios, 2004–06 average to 2009Q4 peak: CRE 56x, residential 30x; against the lowest non-zero quarter, about 330x and 280x. CMBS special servicing: Trepp, August 2026, as reported in the Wall Street Journal, October 6, 2026. FHA: Allysia Finley, Wall Street Journal, February 23, 2025. Subprime vintages: Mayer, Pence, and Sherlund, Federal Reserve FEDS 2008-59. Rasuwa, Nepal flood of August 26, 2026: flood-wave speed from Jeffrey Kargel, Planetary Science Institute, as reported by CNN. Scripture quotations: NABRE. Related posts: Credit Regimes, Risk Management, and the Value of Stress Testing; Are Banks Ready for a Downturn?; Was Private Credit Fooled by Its Own Success?
Updated October 2026. The original version labeled the all-loans charge-off series (CORALACBN) as C&I; this version uses the C&I series (CORBLACBN), and all three portfolios now use non-seasonally-adjusted data. Regime dates and capture rates changed slightly; the conclusions did not.