Insights & News
Insights on risk management, model development, loss forecasting, CECL, and stress testing from practitioners who build the models. Thought before calculation, every time.
When times are good, it’s easy to forget that they’ll end, even if the endpoint is unknown. Forgetting that can be very costly. We explain how the big risk builds during calm times. Losses in subsequent bad times can only be managed in good times. We hint at a new service that measures the risk to manage.


Recent Insights

The Seven Principles of an Effective Capital Adequacy Process
Read more: The Seven Principles of an Effective Capital Adequacy ProcessSpero Risk Associates has substantial experience with all aspects of CCAR, especially model development and validation. We have asked the questions, and we have successfully answered when others have asked. The seven principles of an effective capital adequacy process were published in August, 2013, in the Federal Reserve’s Capital Planning at Large Bank Holding Companies: Supervisory…

Learning Opportunities from “A Christmas Story”
Read more: Learning Opportunities from “A Christmas Story”Learning is a benefit that is important enough to describe separately! Like much financial and credit model development, scenario analysis is research as much as development or construction. Scenario analysis leads to a better understanding of the relationships between the firm and its environment and risk factors. Note that these relationships change through time as…
SR 12-7 and the Five Principles of Stress Testing
Read more: SR 12-7 and the Five Principles of Stress TestingIf CCAR/DFAST is the extent of a firm’s stress testing, then, (a) the firm does not comply with SR 12-7, particularly Principles 1 and 2, and therefore, Principle 5; (b) there are likely deficiencies in overall risk management and data governance/systems that prevent implementation beyond CCAR; and therefore, (c ) any beneficial synergies between or among other…

Does Unemployment Predict CRE Losses?
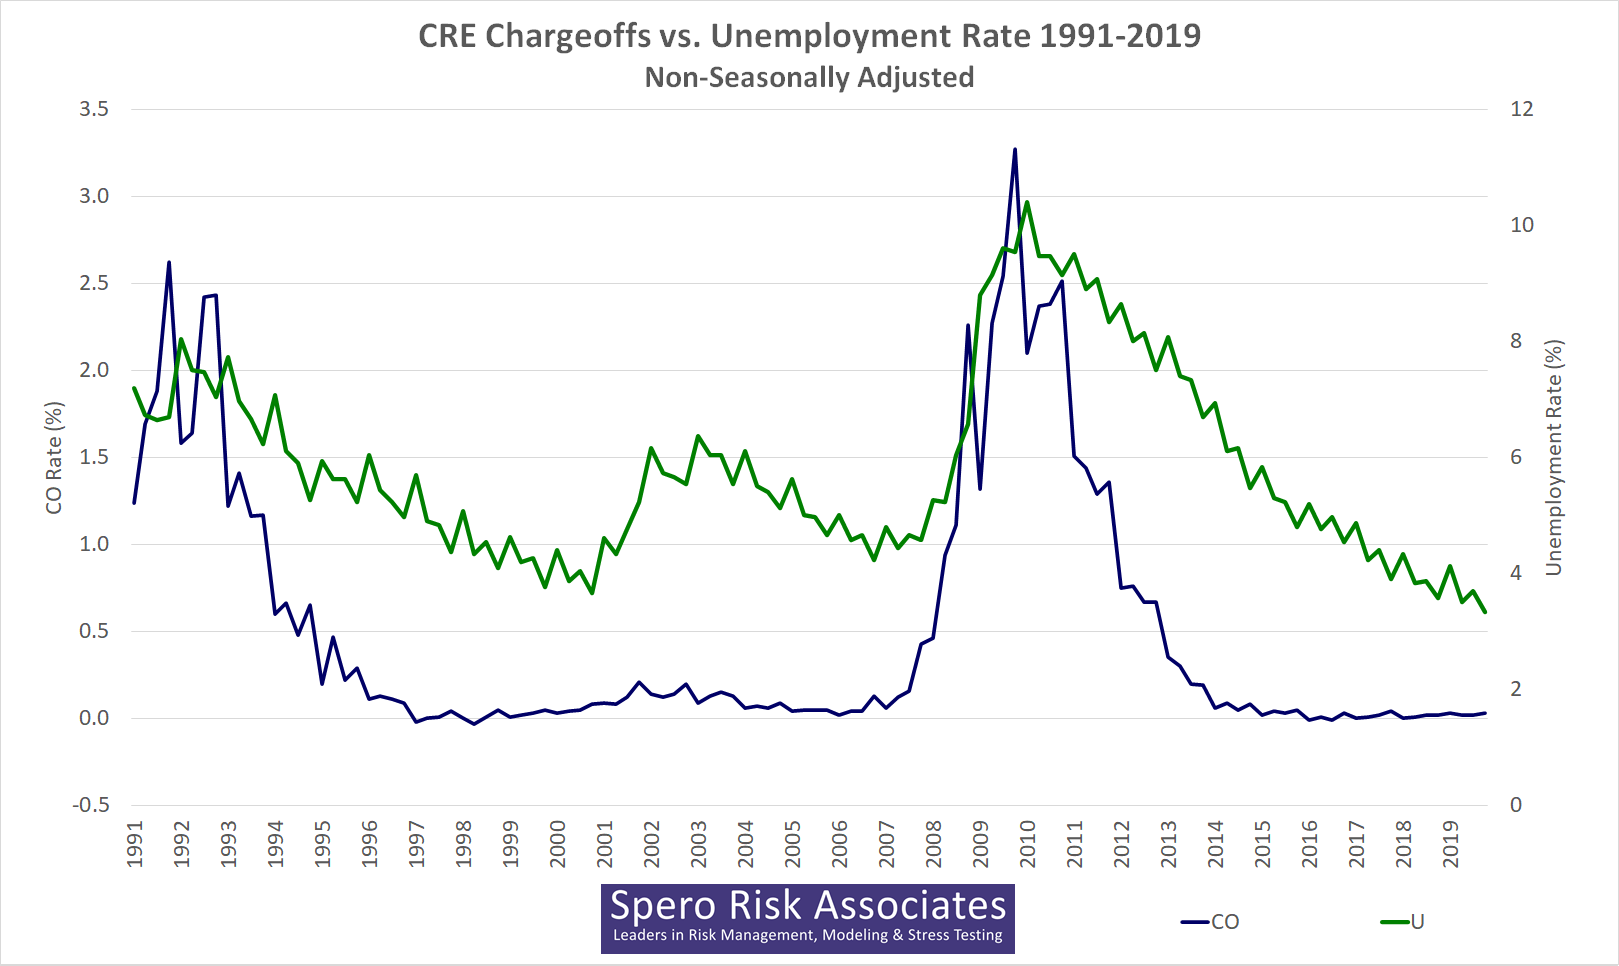
Read more: Does Unemployment Predict CRE Losses?The Fed’s CCAR scenario narrative always leads with unemployment; so, banks feel compelled to use it as a parameter in their loss forecasting models. The problem is that unemployment peaks tend to lag CRE (and C&I) loss peaks, which isn’t a good characteristic for an explanatory variable, especially for stress testing and risk management.

Does Unemployment Predict Commercial Loan Losses?
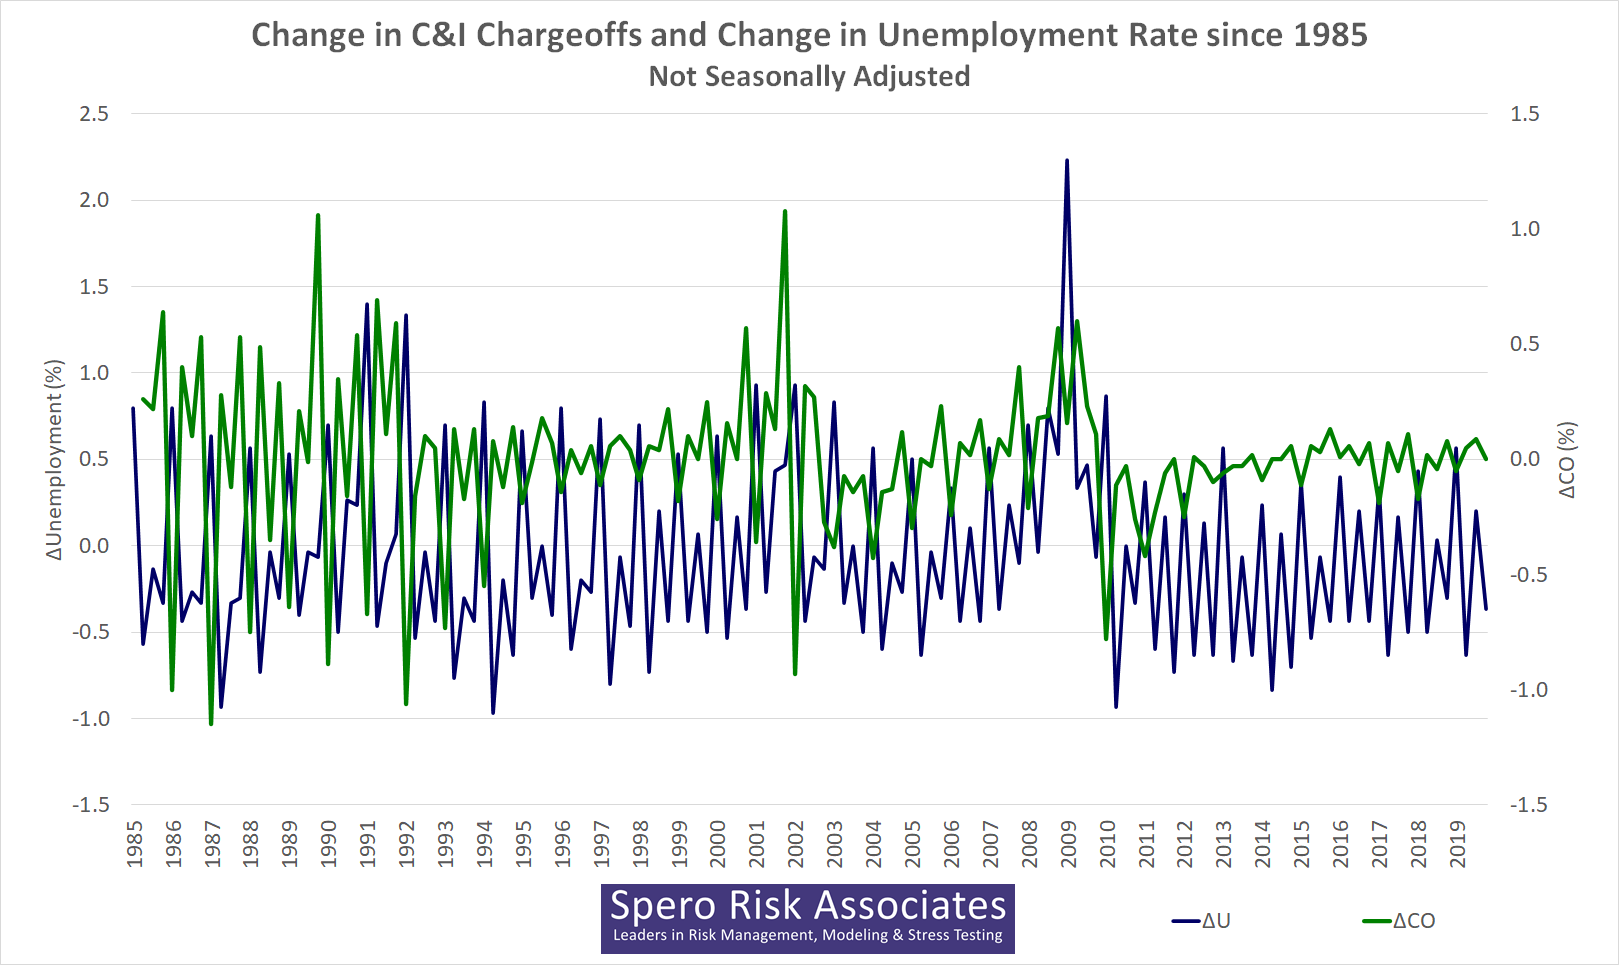
Read more: Does Unemployment Predict Commercial Loan Losses?The Short Answer: Historically, No, It’s the Other Way Around The Long Answer: let’s look at scatter plots and correlations and see the two large problems with using it. This is the third in a series of three posts. Two Regimes In our first post, Unemployment as a Commercial Loan Loss Predictor, we showed time-series…
Q1 2020 Large Bank CECL Reserves
Read more: Q1 2020 Large Bank CECL ReservesBelow are two graphs that show Q1 2020 credit reserves for large, domestic (mostly CCAR) banks — for all large banks reporting earnings as of April 24, 2020. So far, no bank on our list has delayed its CECL implementation — as permitted under the CARES Act.1 Both graphs show the initial CECL reserves, i.e.,…

Alternatives to Unemployment as a Commercial Loan Loss Predictor
Read more: Alternatives to Unemployment as a Commercial Loan Loss PredictorSomeone asked: for loss forecasting, what makes a better leading indicator than the unemployment rate? The answer is usually not another national variable. It’s segmentation. Partition by industry and geography and more intuitive regressors appear, like oil prices for energy defaults.
Unemployment as a Commercial Loan Loss Predictor
Read more: Unemployment as a Commercial Loan Loss PredictorThis the first in a sequence of three posts. The second describes alternatives to the unemployment rate for C&I loss forecasting, and the third one provides more evidence why the unemployment rate is a poor choice for C&I loss forecasting. Recently, we were surprised to learn that many banks use a forecasted unemployment rate as…
2017 – 2019 Federal Reserve and Company Run CCAR Results
Read more: 2017 – 2019 Federal Reserve and Company Run CCAR ResultsAlmost four years ago, we aggregated and published the Fed’s and Companies’ 2016 CCAR results. We’re surprised by the continued interest in those nearly four-year-old numbers; so, we asked one of our analysts to generate similar graphs for 2017, 2018, and 2019. Please note that a few observations from companies are missing; those firms purge…